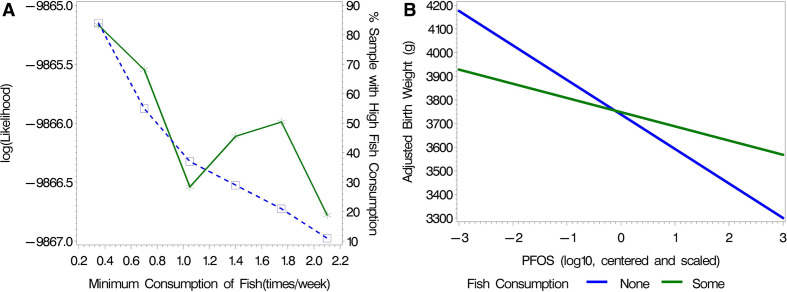
Figure 2.
(A) Determination of an indicator variable for fish consumption between ‘low’ and ‘high’ groups. The log likelihood (solid line) is from the adjusted models including an interaction term with logPFOS. Table 4 provides parameter estimates using the cut at 0.35. The per cent of subjects with high fish consumption (dotted line). (B) The resulting adjusted estimated association between no and some fish consumption using the cut for fish consumption at 0.35 (times/week), at the average for the Z-scored continuous covariates and at the reference level for the categorical variables (table 4). PFOS, perfluoro-octanesulfonic acid.

