Fig. 1.
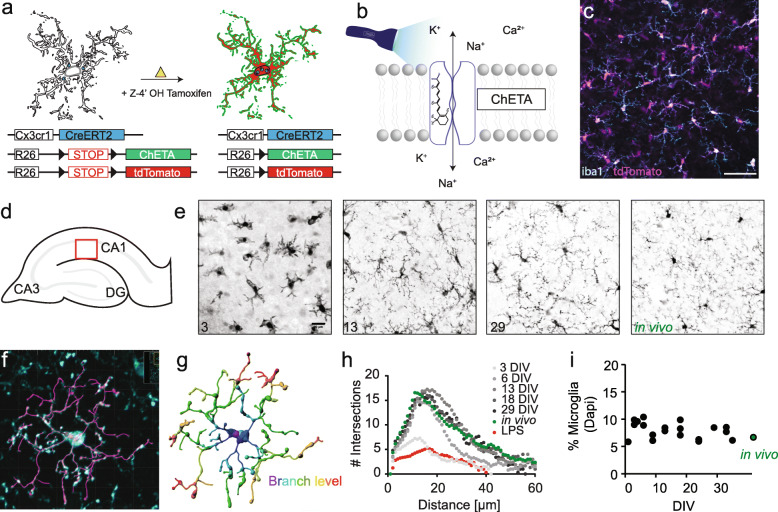
Microglia-specific ChETA expression in organotypic hippocampal slice cultures. a Schematic overview of microglia-specific expression. The microglia-driver line Cx3cr1-CreERT2 (blue) is crossed with a reporter mouse line (R26-LSL-tdTomato, red) and the ChETA mouse line (R26-LSL-ChETA, green). After injection of (Z)-4-hydroxytamoxifen, the tdTomato and ChETA are expressed in microglia. b Illustration of the Channelrhodopsin-variant ChETA activated by blue light. Scale bar 25 μm. c Immunostaining using antibodies against the reporter (tdTomato - red) and microglia (iba1 - cyan). d Graphic illustration of the hippocampal structure and the investigated area for microglia morphology in e (red square). e Z-projection of confocal images acquired for Sholl analysis of microglia at 3, 13, 29 DIV, and in vivo. Scale bar: 25 μm. f Confocal image of a microglia cell in organotypic slice culture which was fixed with PFA and stained against the microglia marker iba1. Overlay with IMARIS analysis (magenta). g Result of microglia branch detection with color coding by branching level. h Sholl analysis of microglia over time (number of intersections versus distance from cell body). i Quantification of % microglia cells between dentate gyrus and CA1 relative to total cell count (DAPI)

