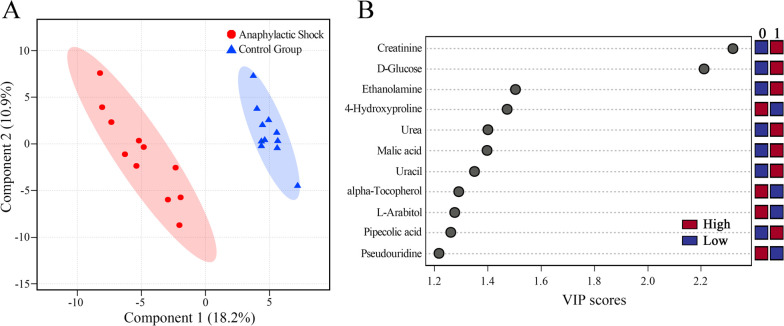
Figure 3.
Screening differential metabolites for the anaphylactic shock group. A: Score plot of the PLS-DA model with R2 = 0.999 and Q2 = 0.890. The 1000 permutation testing resulted in R2 = 0.996 and Q2 = 0.897. B: VIP score plot of metabolites verified in the PLS-DA model between the anaphylactic shock group (0) and the control group (1). Red and blue represent the high and low relative contents of the corresponding metabolites, respectively.

