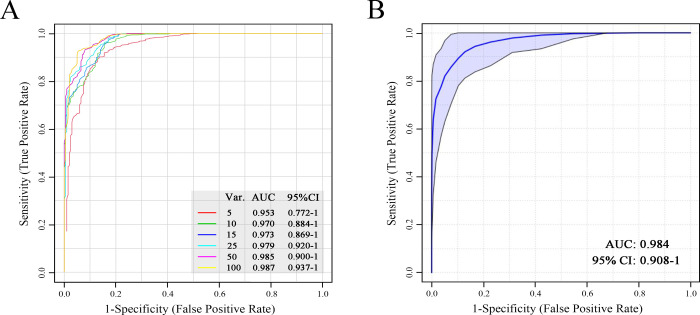
Figure 4.
Evaluation of the classification ability using all the unselected data (A) and a combination of creatinine, pipecolic acid, and ethanolamine (B) via the ROC curve analysis for the anaphylactic shock group. Var.: the number of variables or features used in the model. The six ROC curves were generated using the top 5–100 features (“top” means higher VIP values). AUC: area under the curve; CI: confidence interval.

