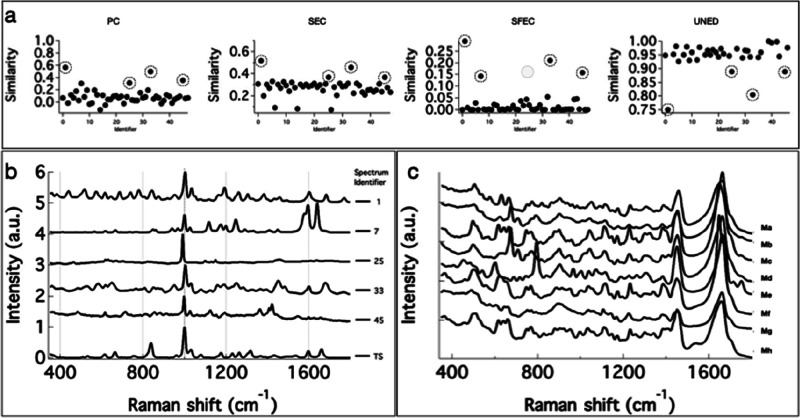
Figure 2.
Results of spectral matching DB search with TS as the search input. (a) Similarity values for each DB spectrum to TS estimated using PC, SEC, SFEC, and UNED methods. (b) Spectra in the DB showing the highest similarity to search input TS. Numbers on the RHS are the identifier in the DB. The corresponding similarity values are circled in Figure 3a. (c) Raman spectra of mangromycin analogues (Ma to Mh)

