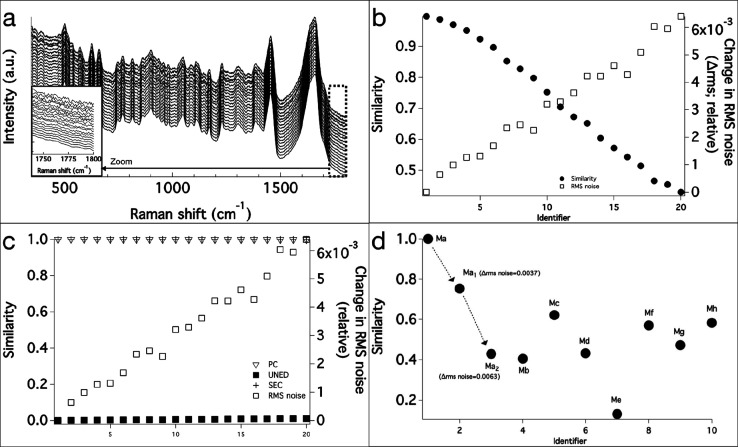
Figure 7.
Effect of noise in the target spectra on the similarity index. (a) Twenty simulated Raman spectra with different rms noise (see main text). (b) SFEC similarity of each simulated spectrum to Ma and the corresponding rms noise in the simulated spectra. (c) Variation of similarity of each simulated spectrum estimated using PC, SEC, and UNED. Noise variation (Δrms) is also shown. (d) Effect of increasing noise in the target spectrum on the spectral matching results. Search input: Ma.

