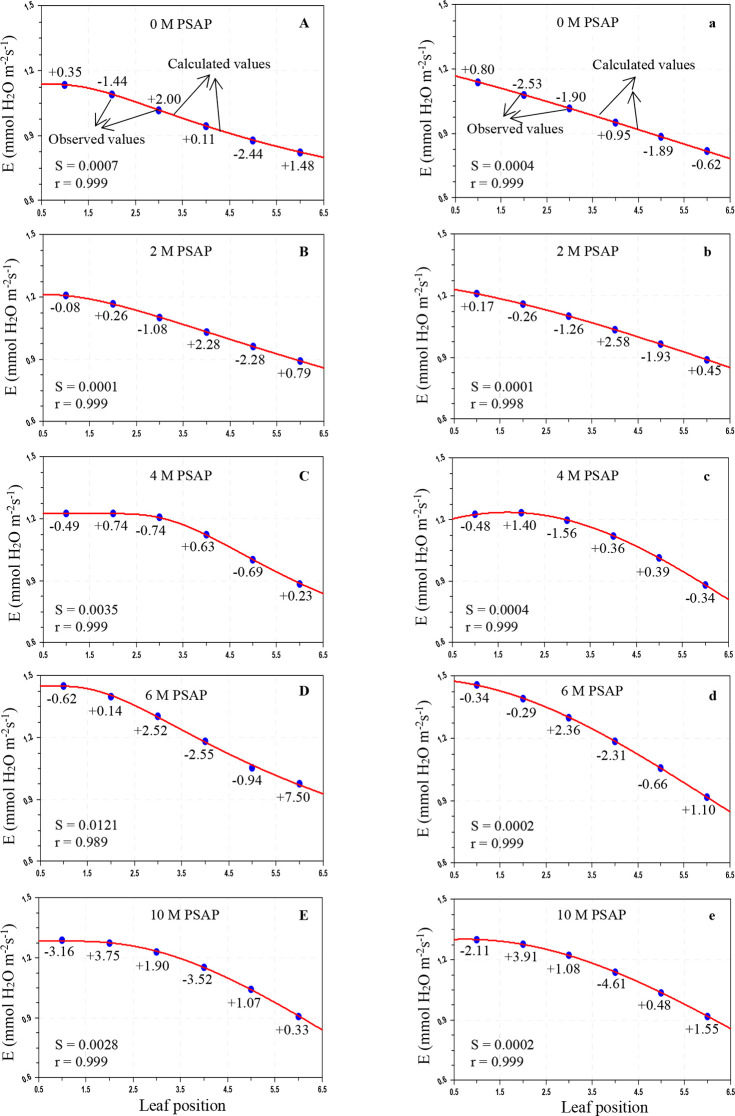
Figure 6.
Variation of transpiration rate (E; mmol H2O m–2 s–1) in sugarcane leaves after application of PSAP (0, 2, 4, 6, and 10 M) under limited water irrigation in the Skewed and Gaussian models. Data are represented as the arithmetic mean (n = 3). Blue ovals denote the observed values and red lines show the calculated values. Parenthesis values indicate percent deviation. (A–E) Skewed model, (a–e) Gaussian model, S = standard error, and r = correlation coefficient.

