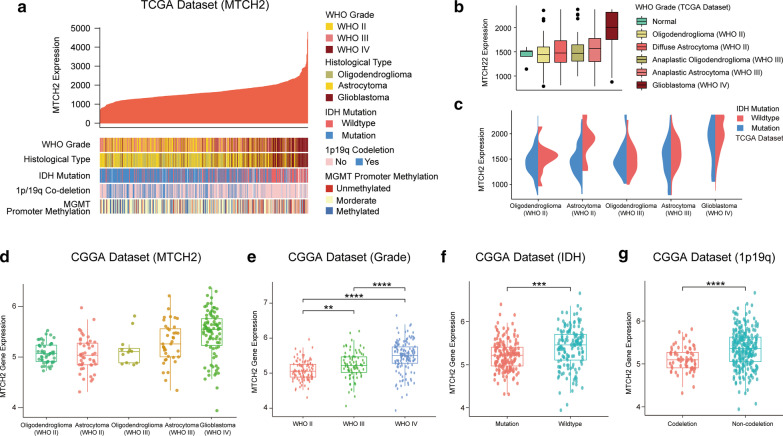
Fig. 2.
MTCH2 expression is associated with glioma malignancy. a Correlation between MTCH2 expression (FPKM) and glioma histology and prognostic biomarkers in The Cancer Genome Atlas (TCGA) dataset. Patients (N = 681) are sort by MTCH2 expression. Glioma histology and biomarkers of patients are shown in color code. b Diagrams showing MTCH2 expressions in glioma histology groups. c Diagrams showing MTCH2 expression of gliomas with IDH status in the TCGA dataset. d–g Diagrams showing MTCH2 expression of gliomas with tumor grade, histology, IDH and 1p19q status in the CGGA dataset

