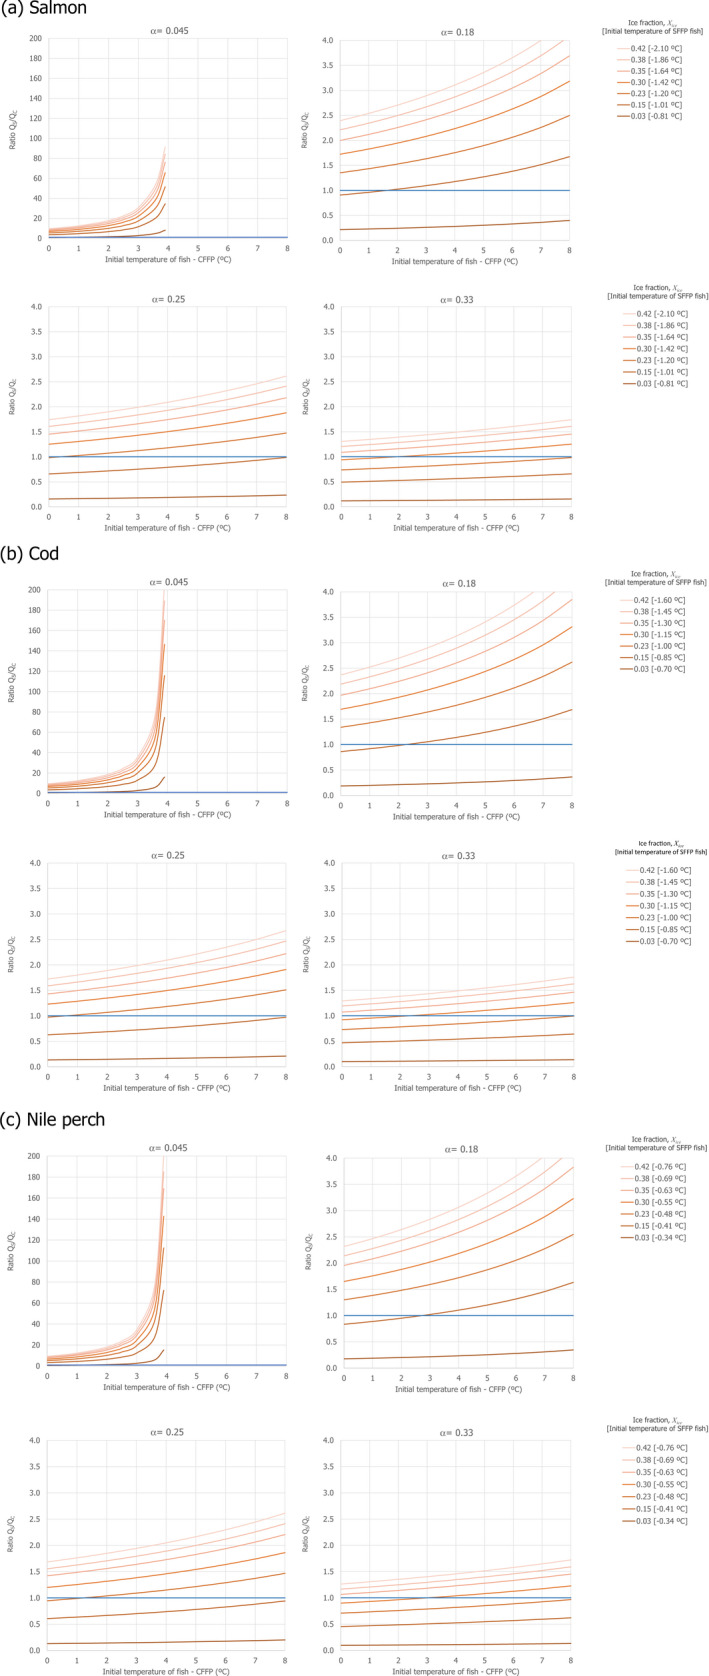
Figure 9.

Ratio between the heat that the SFFP and the CFFP could absorb before all ice has melted (and fish would start increasing in temperature above 0°C) for (a) salmon, (b) cod and (c) Nile perch
- Each plot represents the chosen scenario for different proportions of ice:fish for CFFP (α value, as described in Section 2.1.1). Initial fish temperatures for CFFP are shown on the X axis of the plots. Different lines within each plot represent a target ice fraction of SFFP from 3% to 42%. For salmon, the ice fraction of 3% corresponds to a superchilled salmon with an estimated initial temperature of –0.81°C while an ice fraction of 42% corresponds to –2.10°C. For the simulations, the initial freezing point of salmon was T* = –0.77°C and the free water content was 65.77%. For cod, the ice fraction of 3% corresponds to a superchilled cod with an estimated initial temperature of –0.70°C while an ice fraction of 42% corresponds to –1.60°C. For the simulations, the initial freezing point of cod was T* = –0.68°C and the free water content was 71.75%. For Nile perch, the ice fraction of 3% corresponds to a superchilled Nile perch with an estimated initial temperature of –0.34°C while an ice fraction of 42% corresponds to –0.76°C. For the simulations, the initial freezing point of Nile perch was T* = –0.33°C and the free water content was 72.79%. The values of the initial freezing point and free water content were the mean values calculated from the proximate composition found in literature (Table 2).
