
Figure 10.
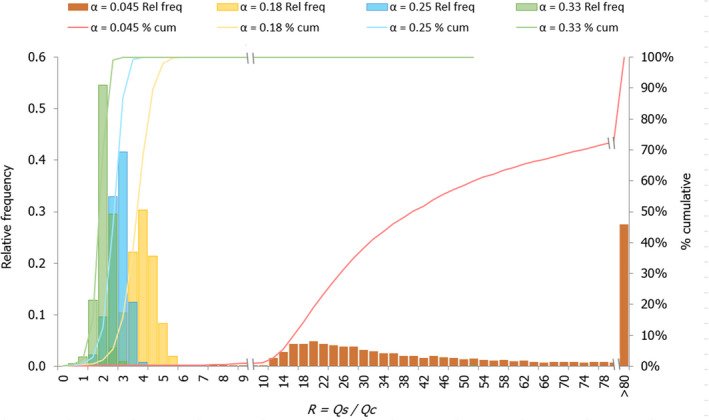
Probability distribution of the ratio (R) between Qs and Qc for Nile perch resulting from the stochastic approach through the heat transfer balance simulation (input values shown in Table 1)
- Relative frequency (Rel freq) and cumulative (% cum) distributions are shown.