
Figure 1.
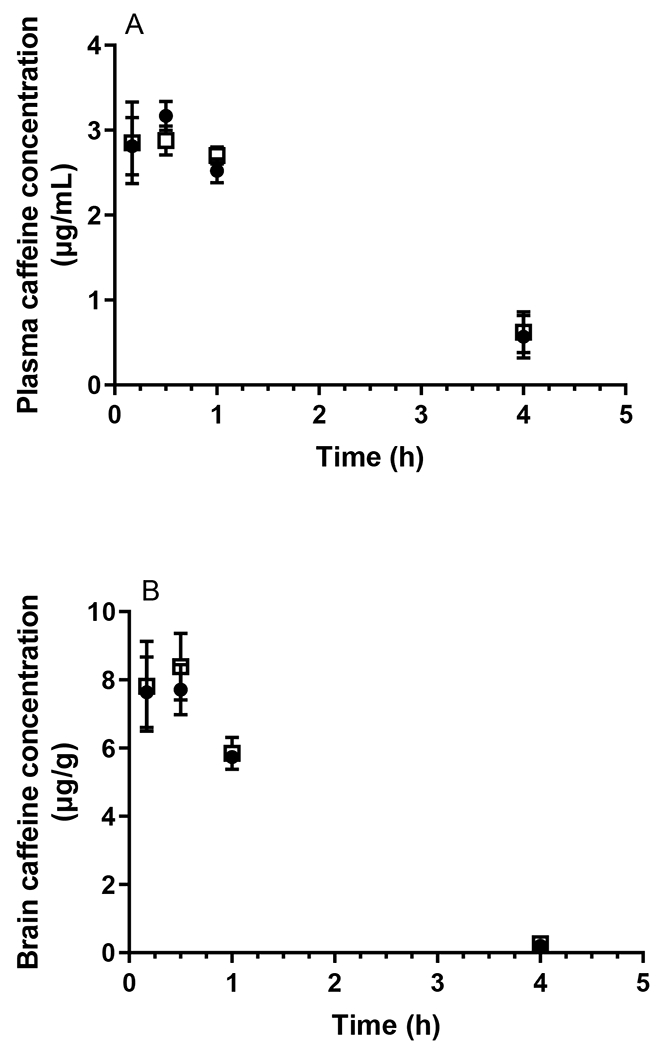
Plasma (A) and brain (B) concentrations of caffeine following oral administration (5 mg/kg) to WT (closed circles) and APP/PS1 mice (open squares). Data are presented as mean ± SD (n=3).
Official websites use .gov
A
.gov website belongs to an official
government organization in the United States.
Secure .gov websites use HTTPS
A lock (
) or https:// means you've safely
connected to the .gov website. Share sensitive
information only on official, secure websites.
Plasma (A) and brain (B) concentrations of caffeine following oral administration (5 mg/kg) to WT (closed circles) and APP/PS1 mice (open squares). Data are presented as mean ± SD (n=3).