
Figure 4.
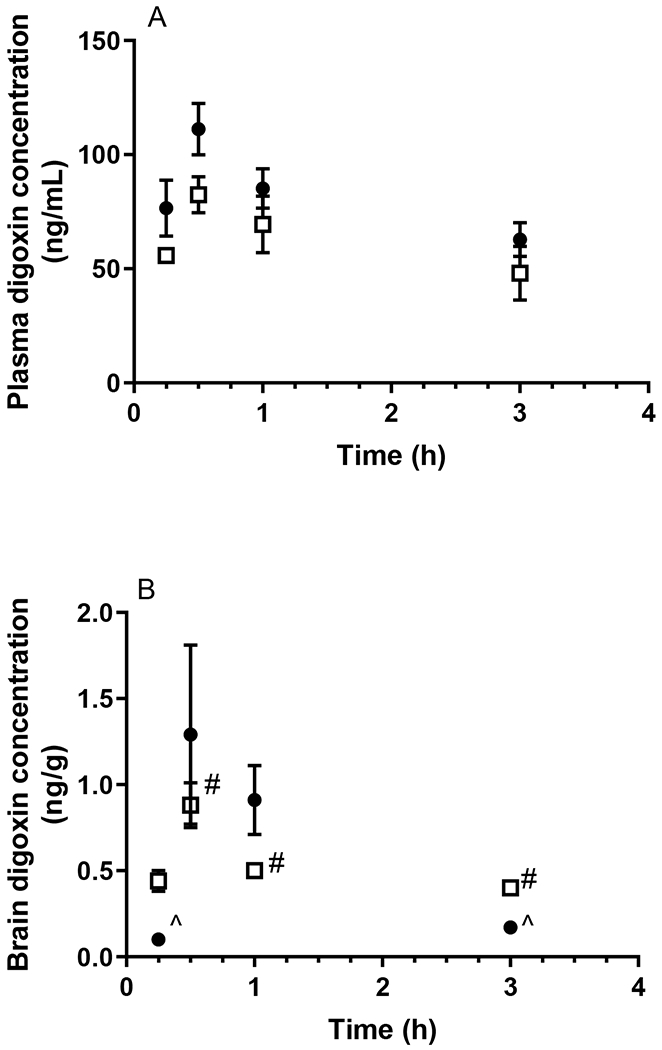
Plasma (A) and brain (B) concentrations of digoxin following oral administration (15 mg/kg) to WT (closed circles) and APP/PS1 mice (open squares). ^ Brain concentrations of digoxin were only detectable in one WT mouse at 0.25 and 3 h. # Brain concentrations of digoxin were only detectable in two APP/PS1 mice at 0.5, 1 and 3 h. Data are presented as mean ± SD (n=3).