
FIGURE 1.
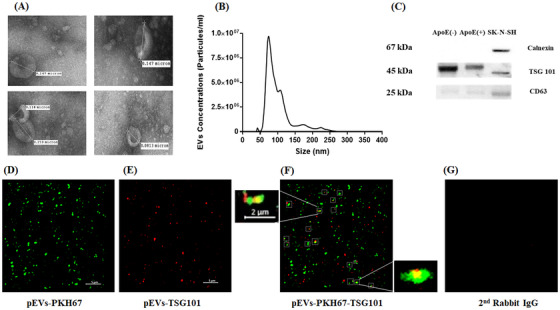
Characterization and visualization of pEVs. (A) TEM images of pEVs; magnification 40.000×. (B) Analysis of the size distribution and concentration. (C) Western blotting for exosomal proteins TSG101 and CD63. (D) Confocal imaging of EVs labeled with PKH67. (E) TSG101 antibodies using Alexa Fluor 594. (F) Co‐localization of PKH67 and TSG101. (G) Anti‐rabbit antibodies with pEVs