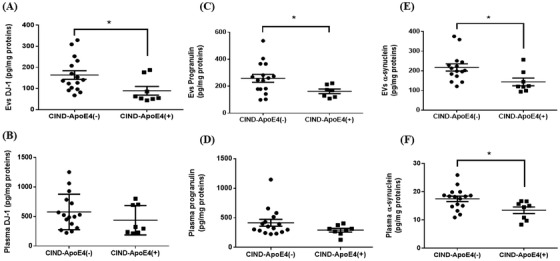
FIGURE 3.

Levels of neurotrophic factors in pEVs and in plasma. Levels of DJ‐1, progranulin, and α‐synuclein measured in pEVs (A, C, E) and in plasma (B, D, F). Graph points indicate individual values for each participant. (−), ε4 non‐carriers; (+), ε4 carriers; apoE, apolipoprotein E; CIND, cognitively impaired, no dementia; EVs, extracellular vesicles. Statistical analysis was performed using the Student t test for DJ‐1 (EVs and plasma) and plasma α‐synuclein. For progranulin (EVs and plasma) and EV α‐synuclein, the Mann‐Whitney test was used. Values are mean ± SEM with * P < .05 versus CIND‐ApoE4(−)
