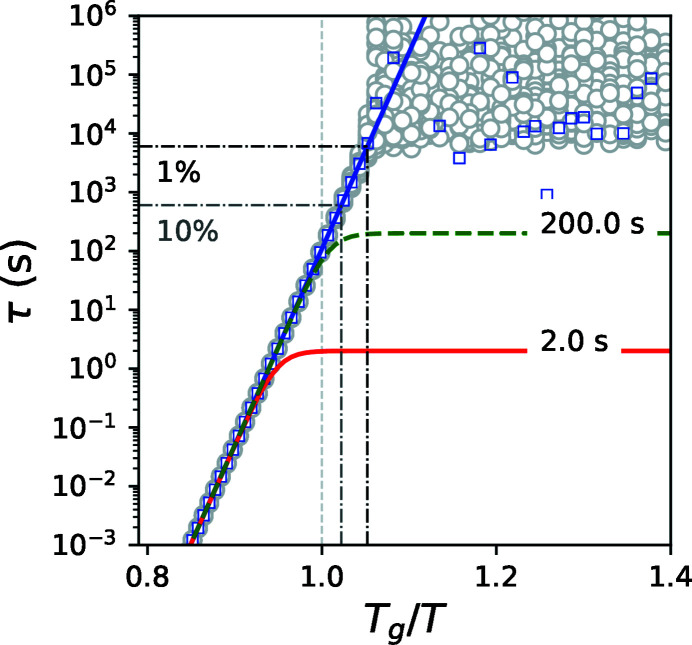
Figure 3.
Temperature dependence of the relaxation times with 100 more flux for τ(F 1, T) than in Fig. 2 ▸. The blue line is τs(T), the green dashed line is τ(F 2, T) with σ = 1%, the red line is τ(F 1, T) with σ = 0.1%, gray circles are 100 estimated points of τs(T), blue squares are the average of 100 estimated points of τs(T), black and gray dash-dot lines are the upper limits for σ of τ(F 2, T) 1% and 10%, respectively.

