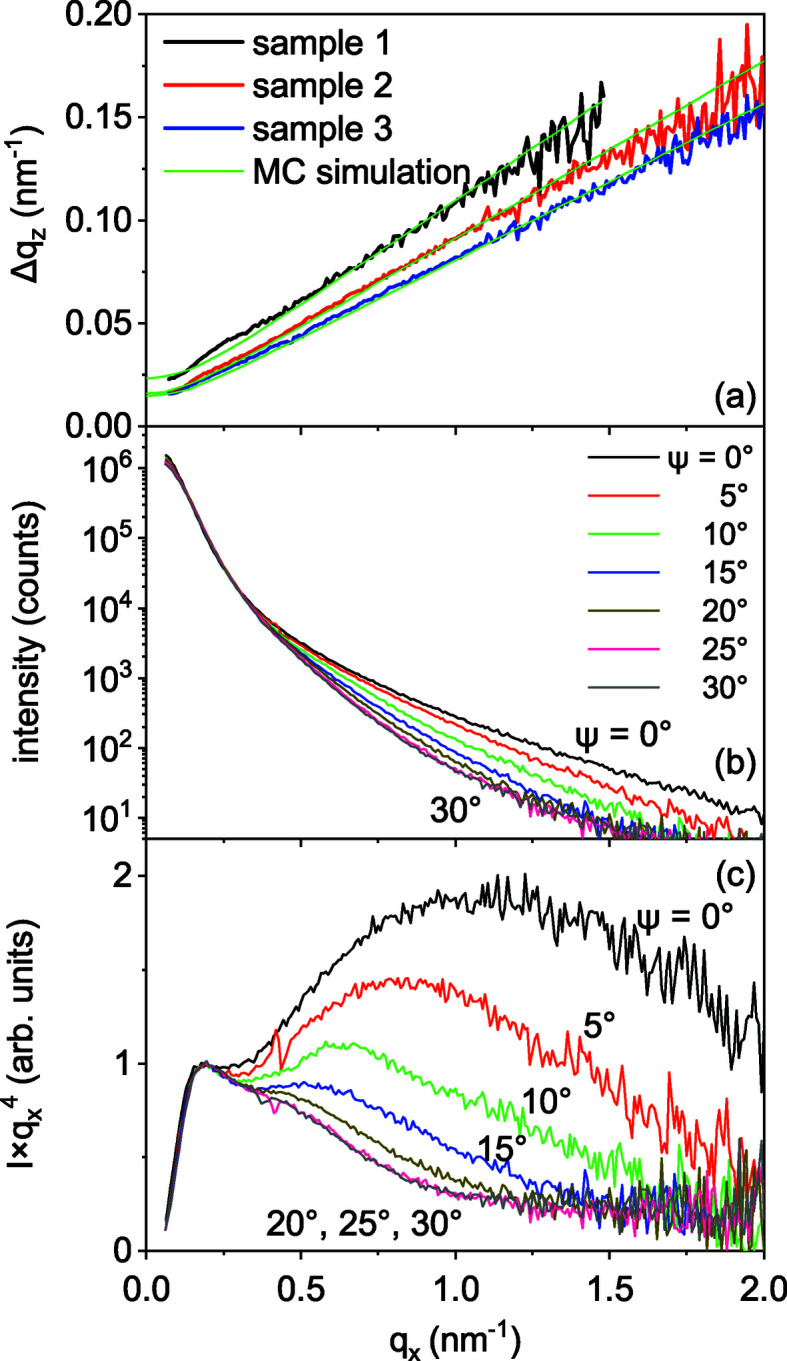
Figure 4.

(a) FWHMs of the intensity profiles Δq
z as a function of the wavevector q
x. Green lines are the results of the Monte Carlo simulations described in Section 4. (b) GISAXS intensity of sample 1 as a function of the wavevector q
x at varying azimuthal orientations ψ. (c) The same intensity profiles as in panel (b) but plotted as  versus q
x.
