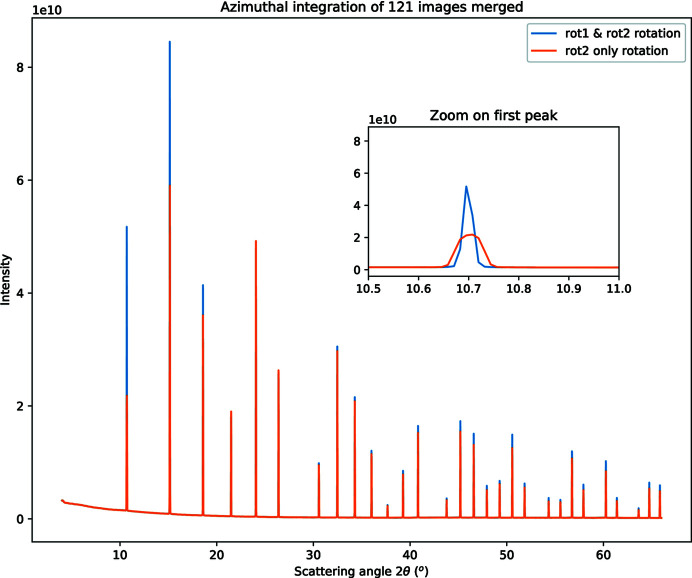
Figure 9.
Powder diffraction pattern obtained from 121 Pilatus 100k images acquired at goniometer angles ranging from 5° to 65° on an LaB6 reference sample at 16 keV. The insert is a close-up view of the first peak showing the sharpness of the signal depending on the model. The orange curve corresponds to the simple model where rot 2 depends linearly on the goniometer angle (six DoFs). The blue curve corresponds to an advanced model where both rotations (rot 1 and rot 2) depend linearly on the goniometer angle (seven DoFs).

