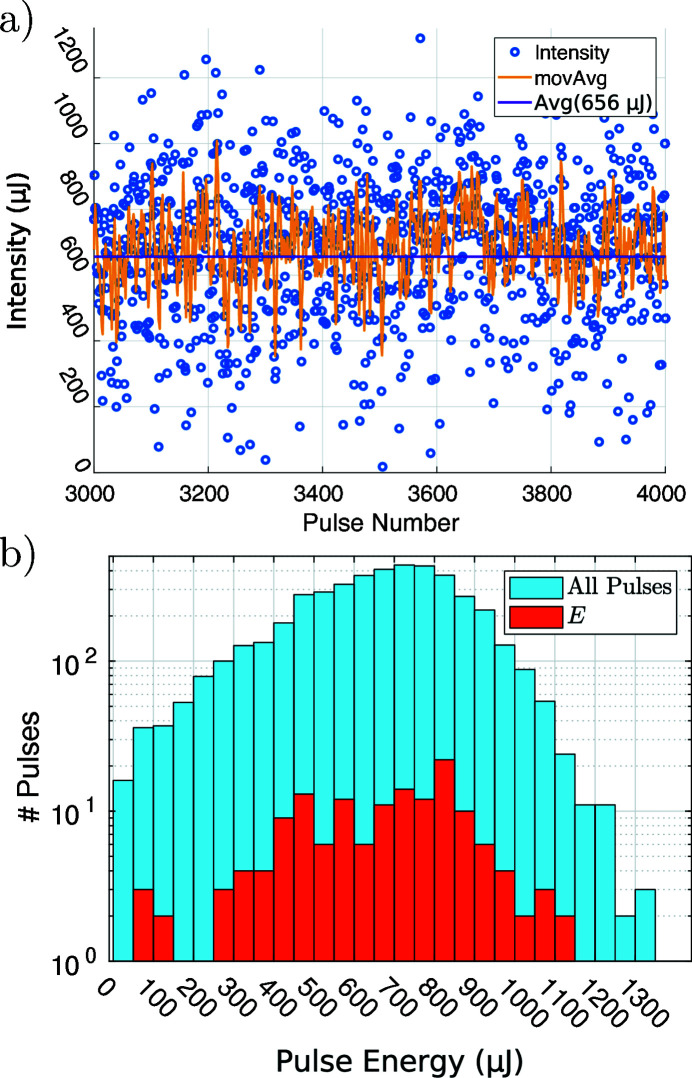
Figure 2.
Pulse to pulse variations. (a) Time series of the energy per pulse for 1000 consecutive pulses of run 246. The moving average (movAvg) is taken over five adjacent pulses. The average pulse energy was calculated from the data of the whole run, consisting of 4000 pulses. (b) Histogram (blue) of pulse energies for the whole run. The fraction indicated in red stems only from empty pulses; these are used in Section 3.1 as input E for the PCA.

