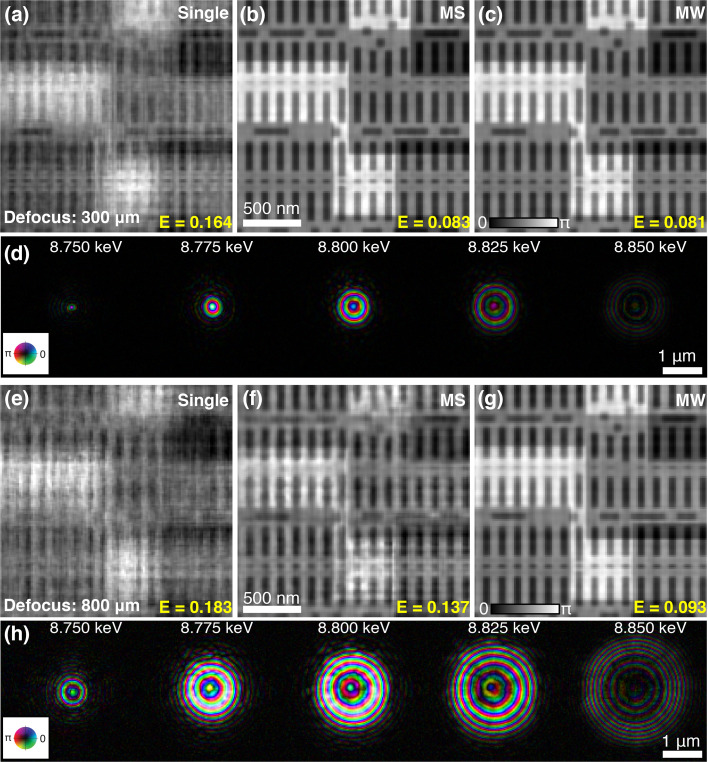
Figure 2.
Reconstruction comparison with different beam sizes. A ptychographic dataset acquired with 500 nm beam size is reconstructed by single-mode ptychography (a), mixed-state (MS) method (b) and multi-wavelength (MW) method (c). Panel (d) shows the simultaneously reconstructed five spectral probe modes during the reconstruction of (c). Panels (e)–(g) are reconstructions for 1.5 µm illumination beam size using single-mode ptychography, MS method and MW method, respectively. Panel (h) shows the five spectral probe modes obtained simultaneously in the reconstruction of (g).

