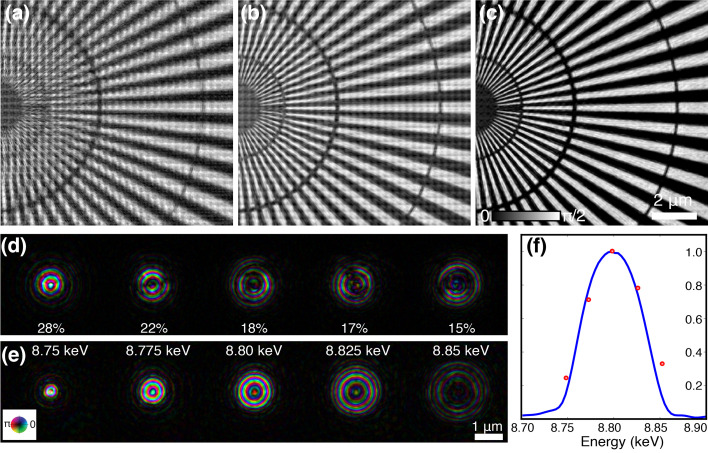
Figure 4.
Experimental broadband ptychography using a DMM source with 1% bandwidth. The phase image of a Siemens star sample reconstructed by (a) single-mode ptychography reconstruction, (b) mixed-state approach, and (c) multi-wavelength approach. (d) Five orthogonal probe modes reconstructed together with (b), the inset values show the power percentage of each mode. (e) Five spectral probe modes from the reconstruction of (c), with its relative power percentage marked by the red dots in (f). The blue curve in (f) shows the measured spectrum of this DMM source in the experiment.

