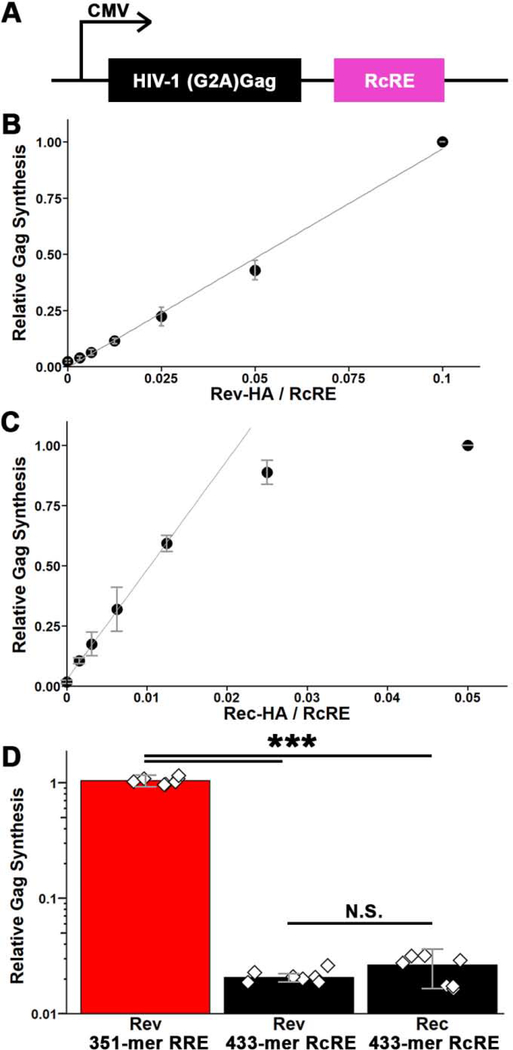
Figure 3.
Nuclear export activity of the RcRE in the presence of HIV-1 Rev protein. A) Schematic of the HIV-1 Gag reporter vector used to assess the nuclear export activity of the RcRE. B and C) 433-mer RcRE activity as a function of Rev (B) or Rec (C) concentration (mass ratio of protein- to RcRE-expression plasmid). Activity is reported relative to Gag detected in the presence of the highest Rec or Rev protein concentration and normalized to actin levels and transfection efficiency. Error bars represent standard deviation among 3 replicates. D) Comparison of the relative activity of RRE and RcRE with Rev or Rec proteins. The protein production was quantified (by anti-HA antibody) and used to normalize Gag signal. Error bars represent standard deviation among 7 replicates. Diamonds represent individual experiments. ***, p < 0.001; N.S., not statistically significant (p > 0.05).

