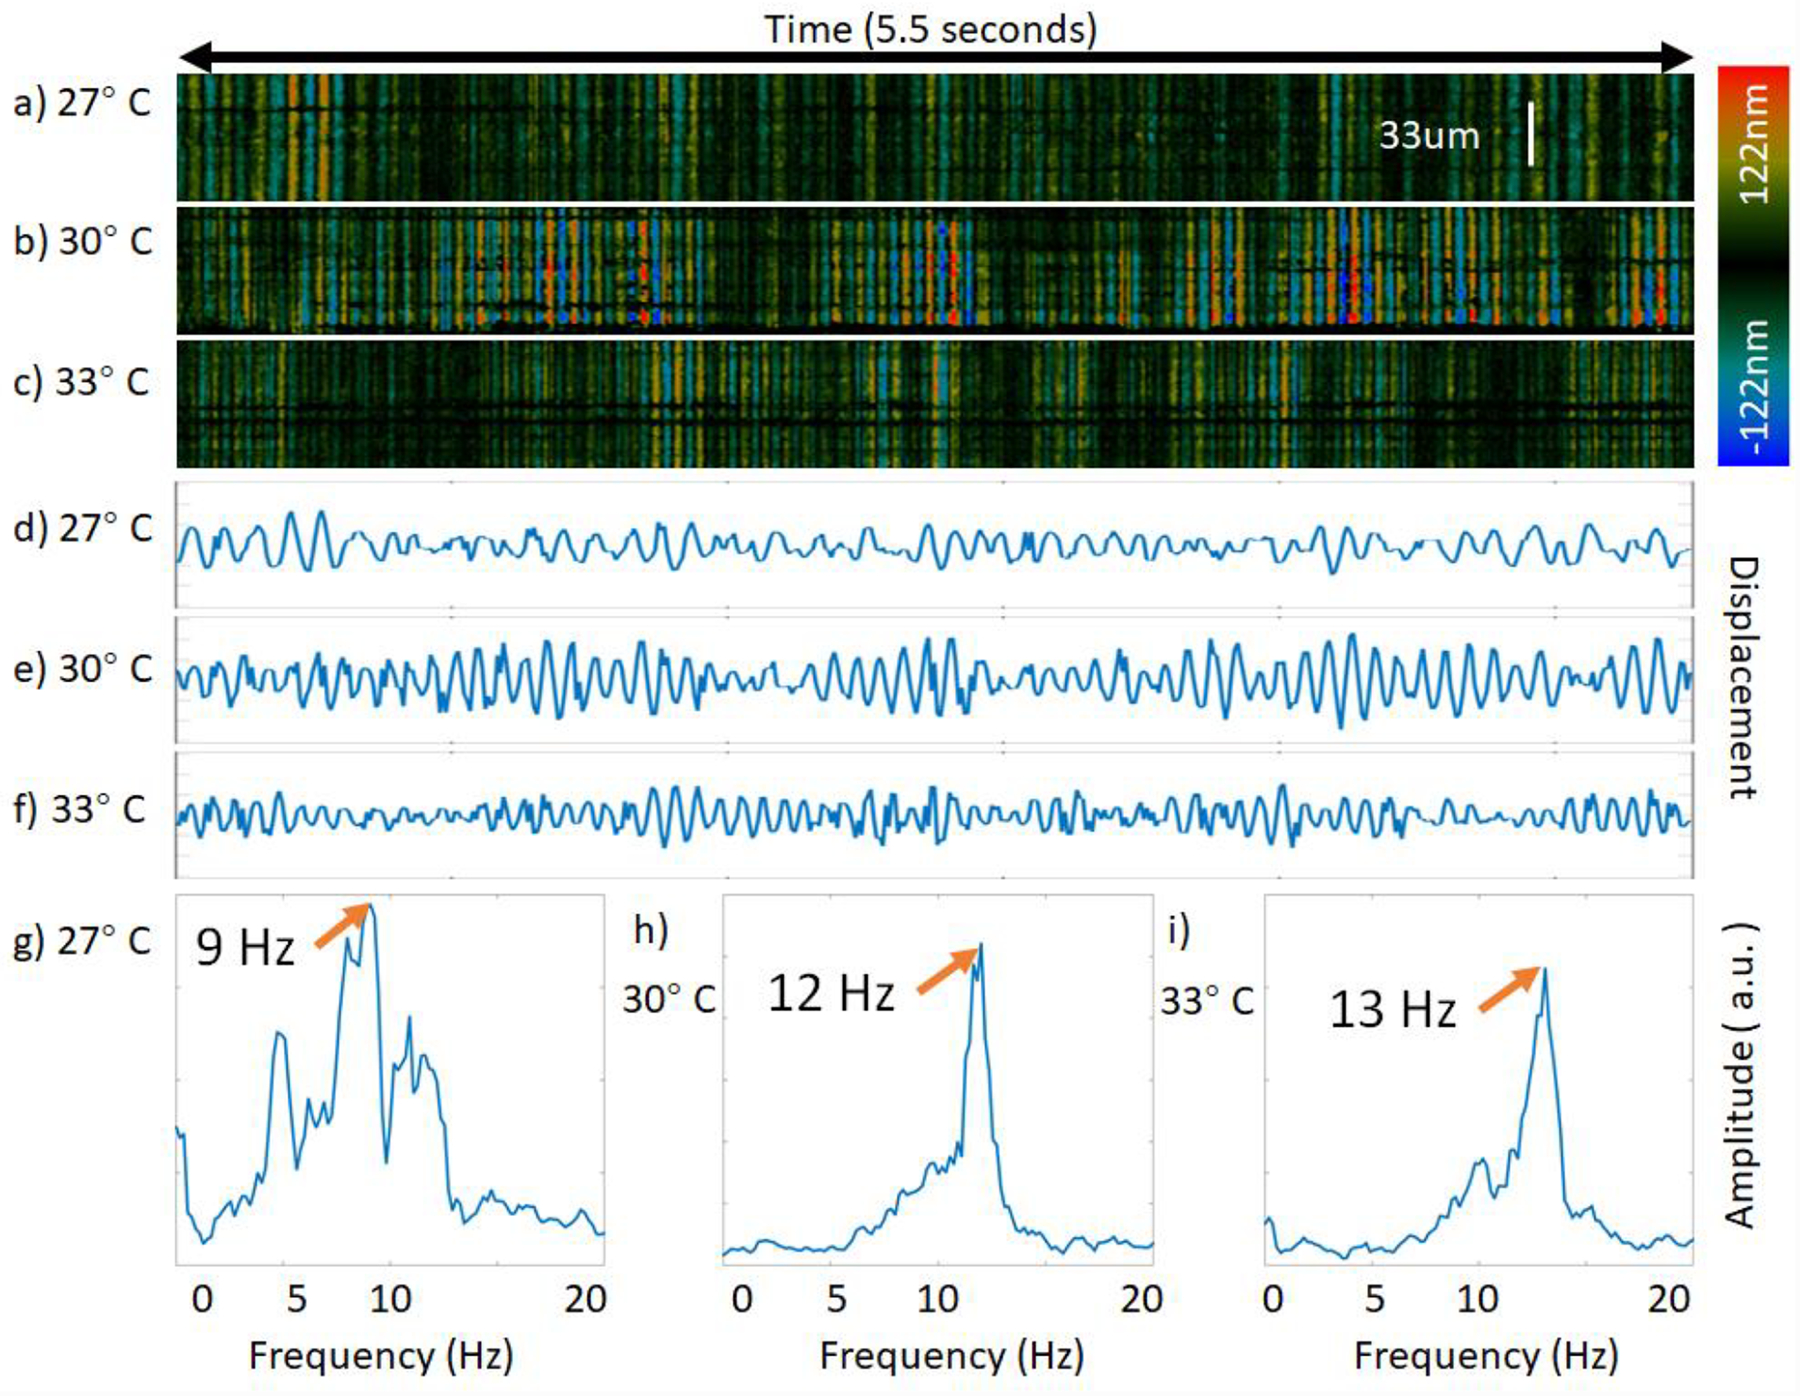
Fig. 5.

Ciliary beat frequency measurements at a single location on synchronized cilia; the color bar encodes displacement of ciliary activity in images a-c). a-c) Raw phase data over depth, d-f) mean phase plot of raw data, g-i) frequency distribution after FFT.
