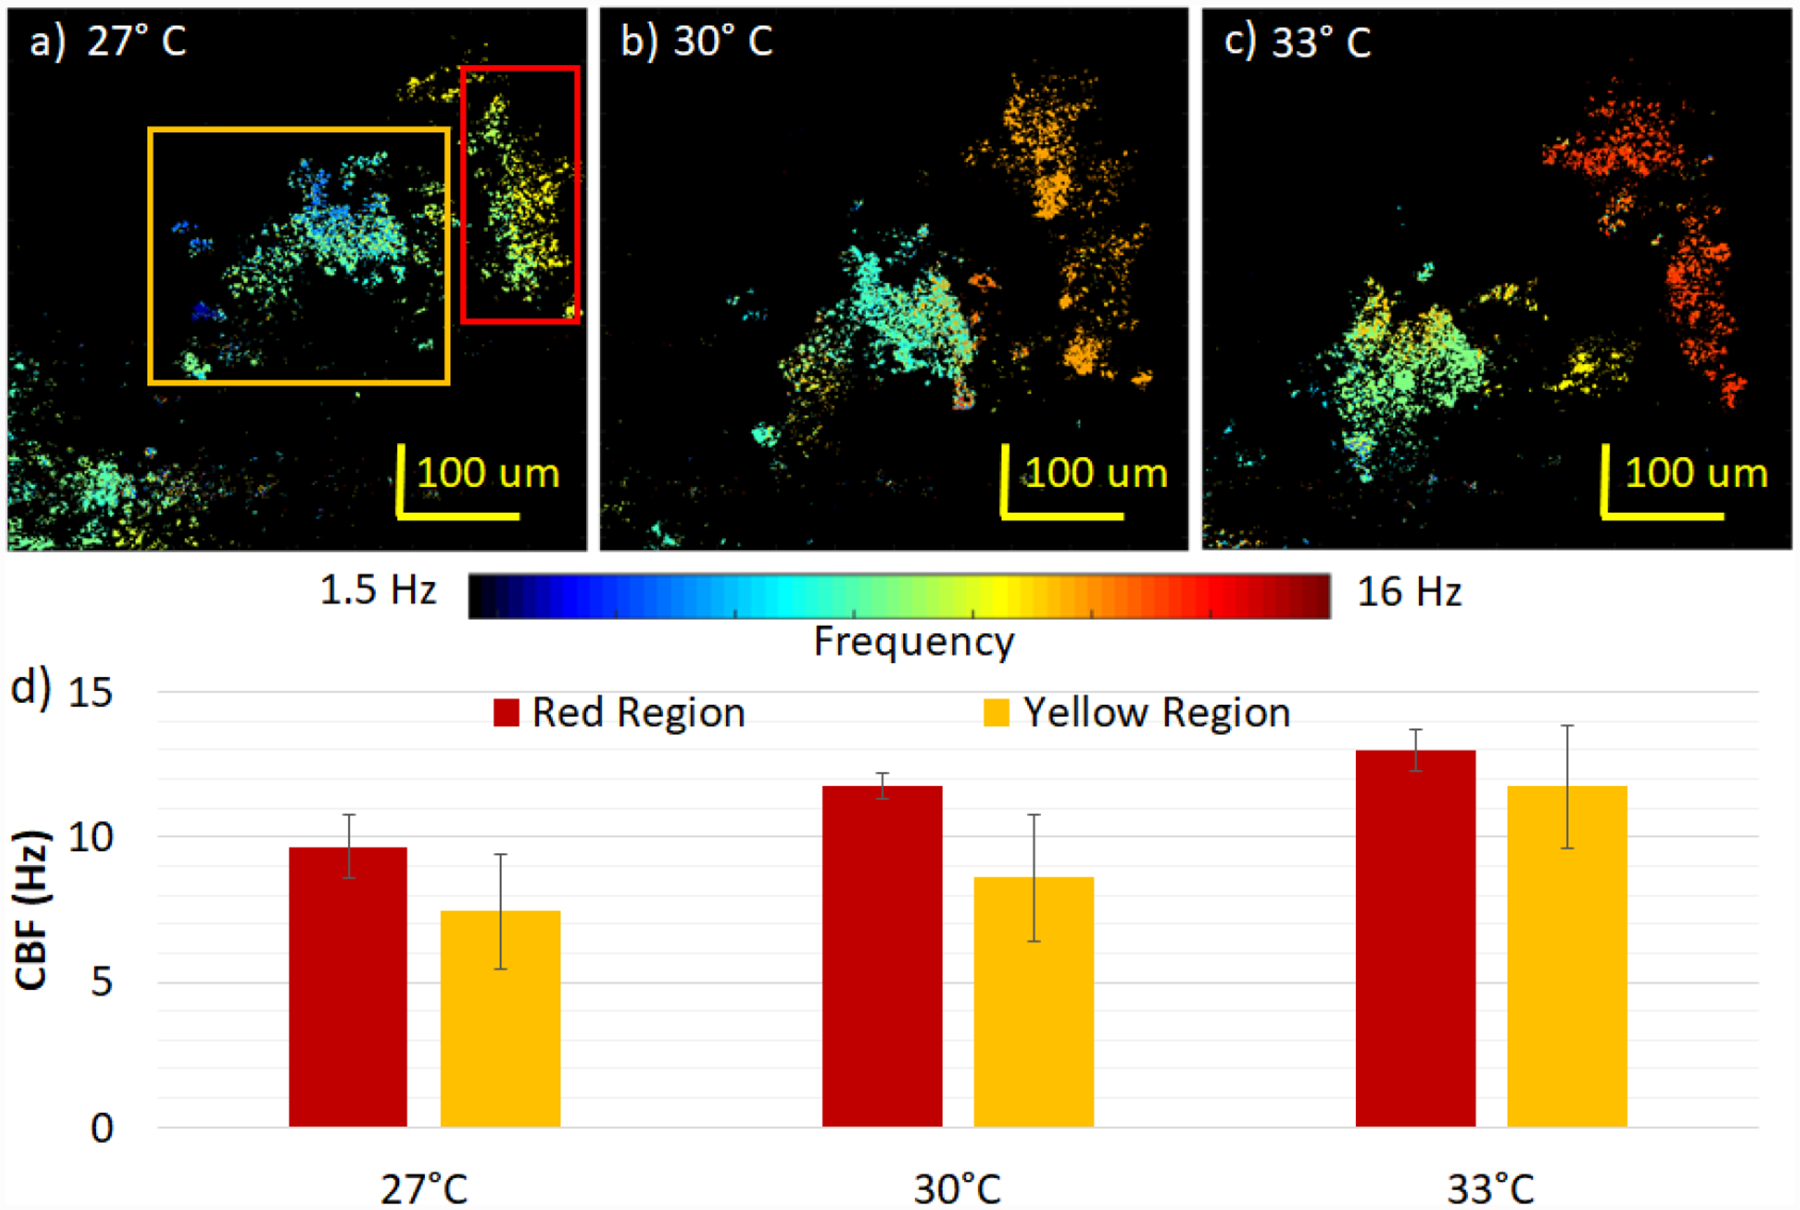
Fig. 6.

Spatial distribution of ciliary beat frequency with changes in temperature. The color bar encodes the CBF for images a-c): a) at 27 °C, b) at 30 °C, c) at 33 °C with the same corresponding region. d) CBF analysis of yellow and red regions. The CBF at 27 °C, b) at 30 °C, c) at 33 °C for the red region is 9.7±1.1 Hz, 11.8±0.5 Hz, 13.0±0.7 Hz and for the yellow region, 7.4±1.9 Hz, 8.6±2.2 Hz, 11.7±2.1 Hz, respectively.
