Fig. 7.

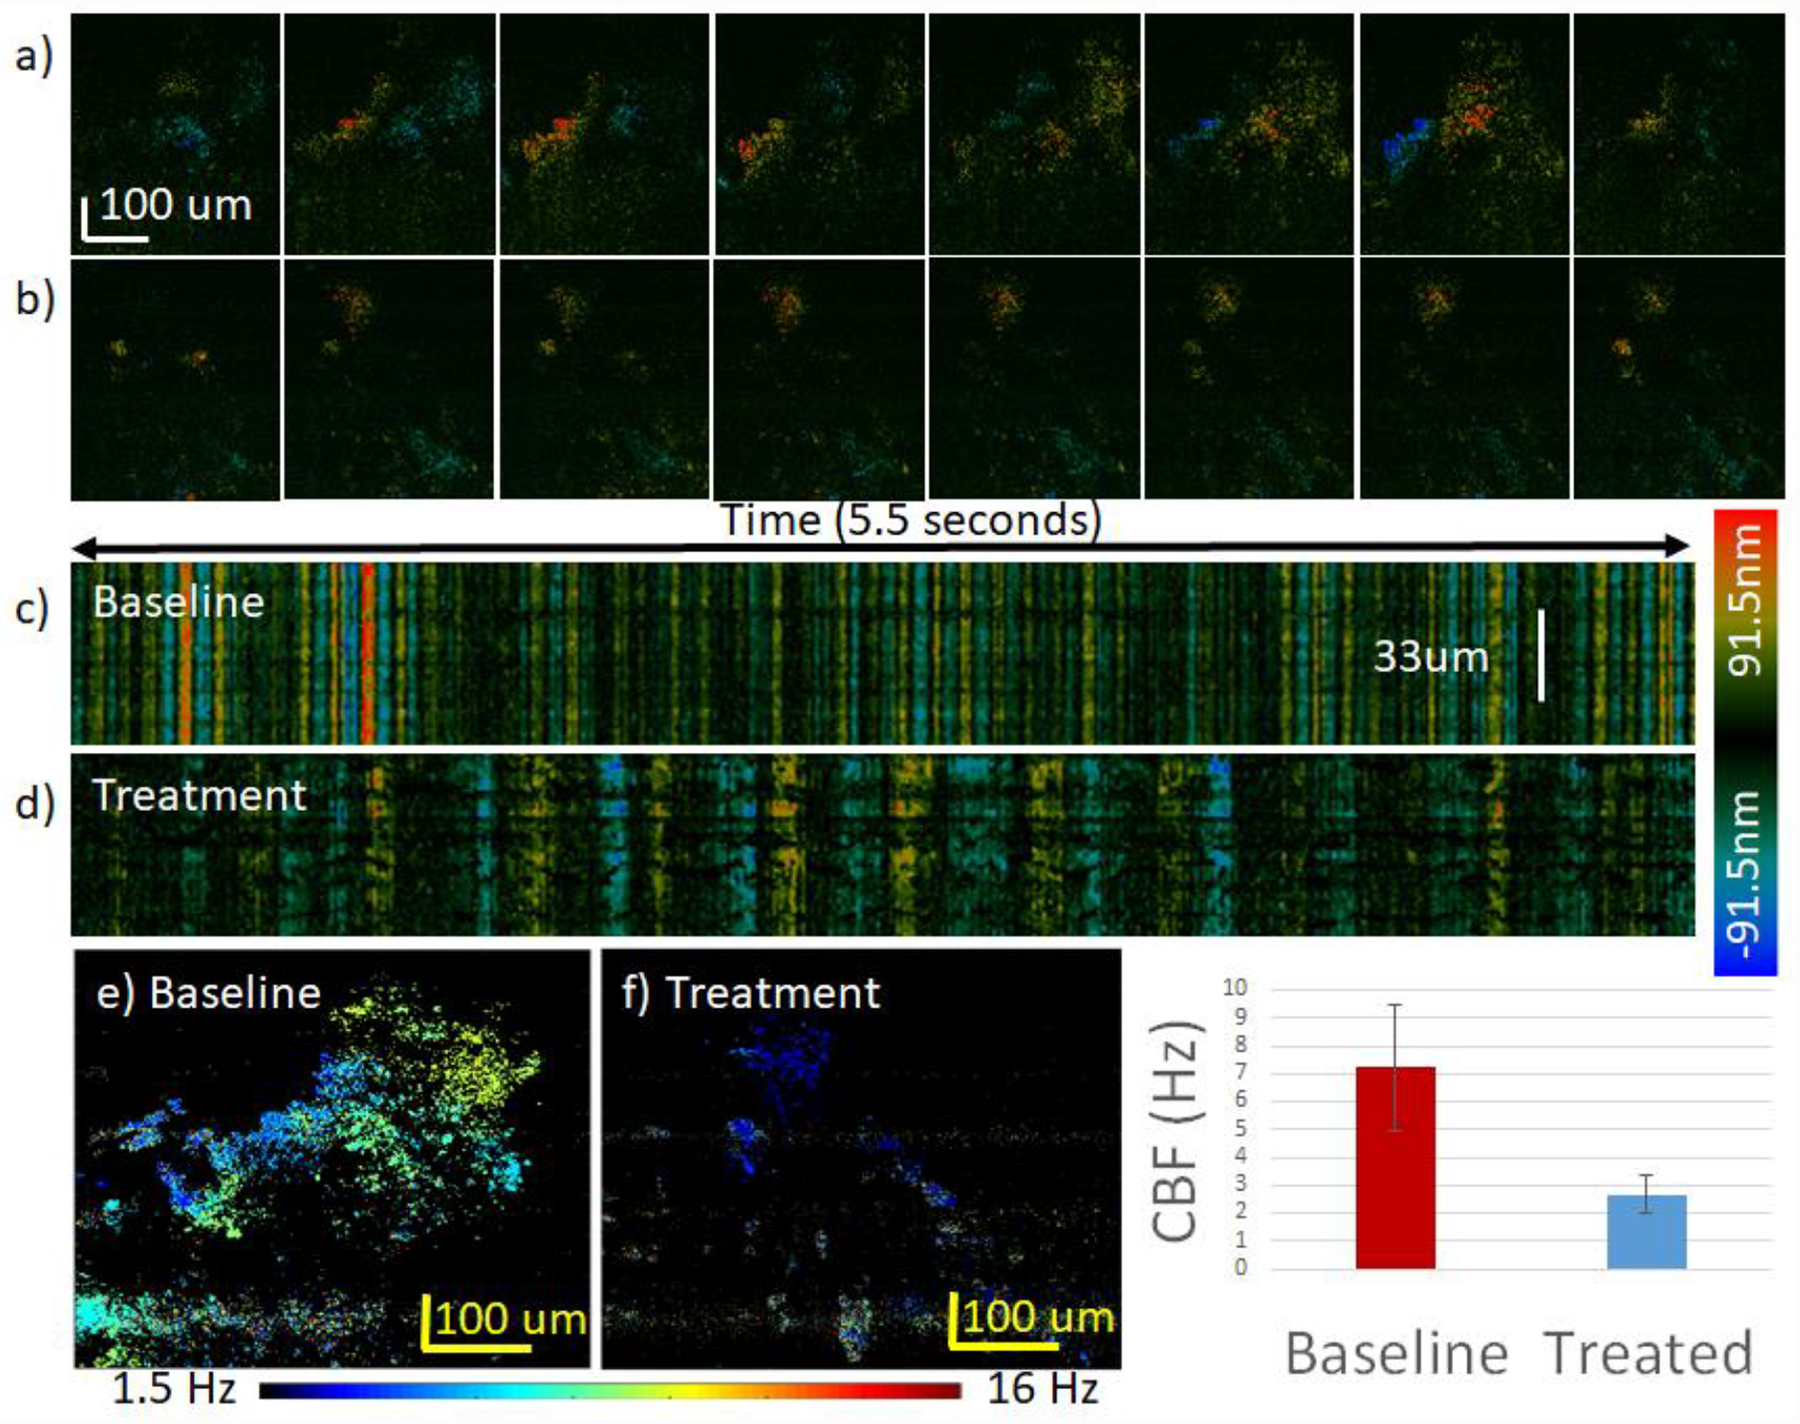
Effect of 2% lidocaine treatment on CBF. The color bar on the right of images c-d) encodes ciliary displacement for images a-d). The color bar on the bottom encodes the CBF for images e-f). a) Synchronized cilia cycle from 0 to 0.2 s for baseline sample at 23 °C. b) Synchronized cilia cycle from 0 to 0.2 s for treatment sample at 23 °C. c) Raw phase data of baseline data. b) Raw phase data after treatment. Note that most of the cilia were no longer active after treatment, and a small region of active cilia was used for analysis. e) Spatial distribution of CBF for baseline sample. f) Spatial distribution of CBF for treatment sample. g) CBF analysis of entire region. The CBF before treatment was 7.2±2.2 Hz and decreased to 2.7±0.7 Hz after treatment.
