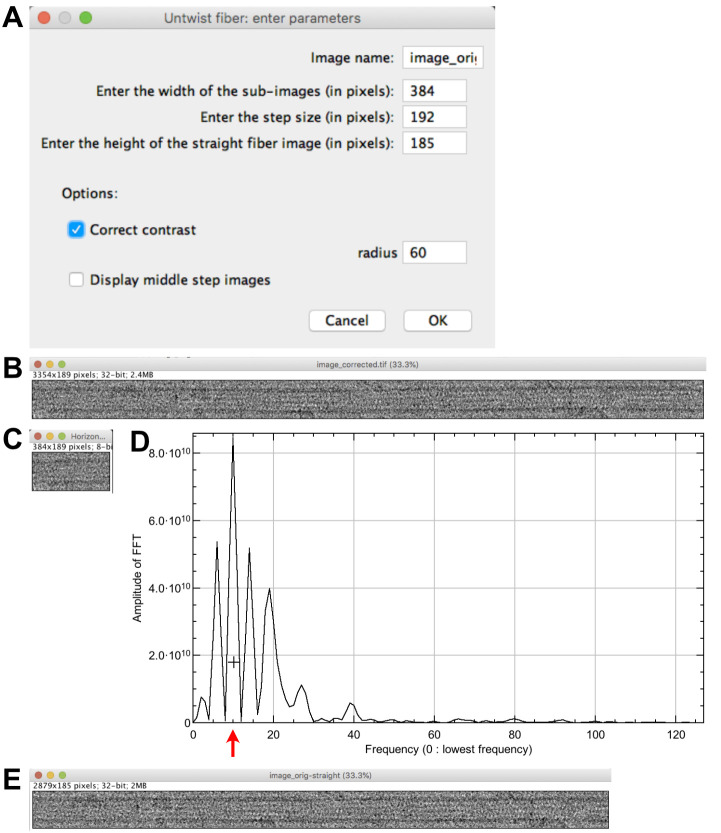
Figure 3. Microtubule straightening.
A. Straightening parameters. B. Contrast corrected image. C. First sub-region from the left. D. Line profile of the equator of the microtubule sub-region Fourier transform. The cross is placed at the level of the second large peak of the J0 Bessel term (red arrow). E. Straightened microtubule image.

