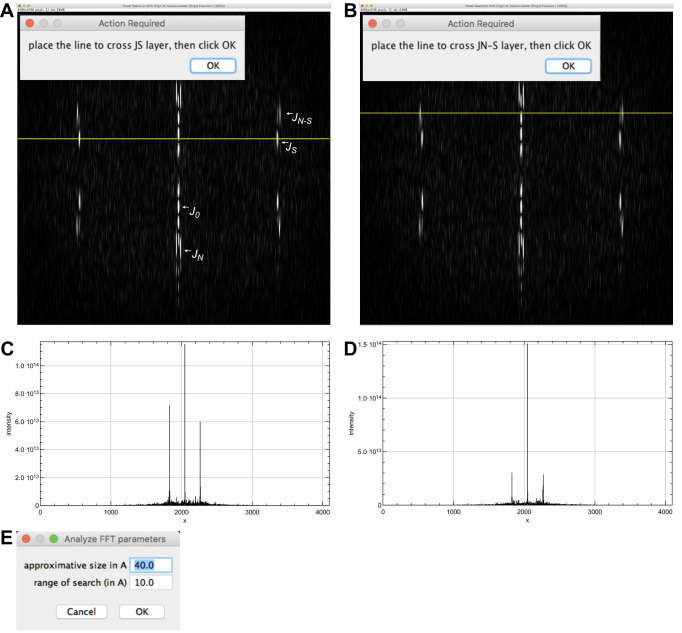
Figure 5. Analysis of the microtubule Fourier transform.
A. Selection of the JS layer line. The main layer lines are indicated. J0 lies on the equator of the Fourier transform. JS is closer to the equator than JN-S, indicating that the microtubule has right-handed protofilaments. B. Selection of the JN-S layer line. C. Line profile along JS. D. Line profile along JN-S. E. Peak search interval.

