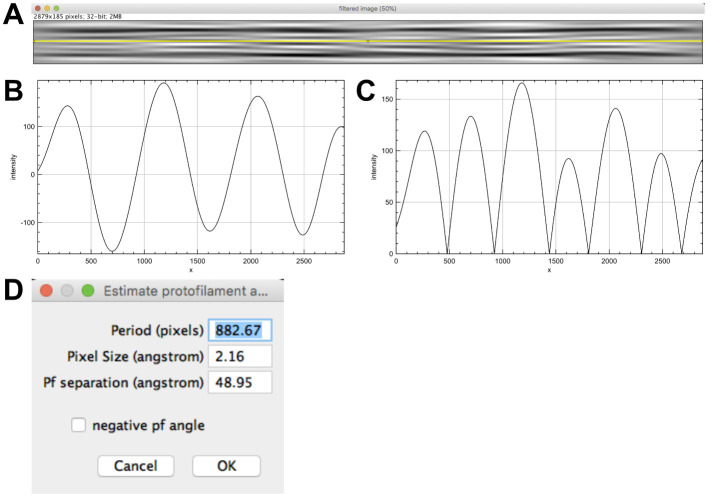
Figure 7. Determination of the protofilament skew angle.
A. Selection of the moiré profile. B. Line profile revealing the moiré period (distance between two maxima or minima). C. Absolute value of the moiré period. This strategy has been implemented to measure low protofilament skew angles where only half the moiré repeat is present (like in most 13_3 microtubules).

