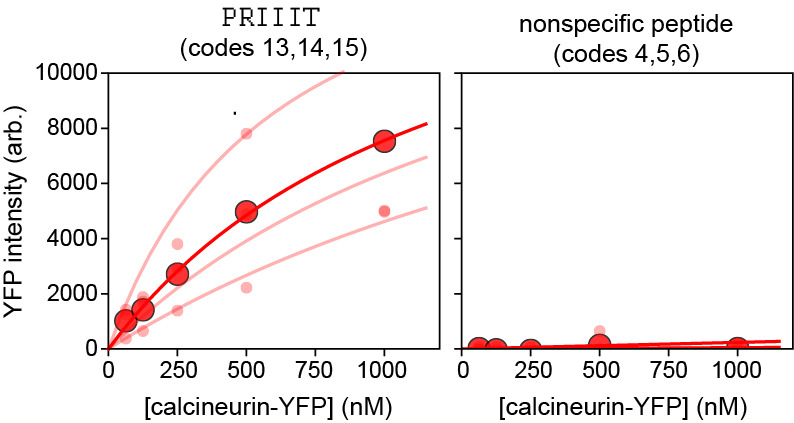
Figure 10. Concentration-dependent binding measurements and Langmuir isotherm fits for Calcineurin-YFP binding to 2 peptides from the 16-sequence MRBLE-pep library shown in Figure 9.

Median background-subtracted fluorescence intensities for all beads with each code displaying a given peptide sequence are shown as light red dots; associated lines show Langmuir isotherm fits used to extract binding affinities. Dark red dots and lines indicate median bead intensities measured across all 3 codes and associated Langmuir isotherm fit to these median values. The left plot shows curves for a known calcineurin substrate (PRIIIT, Kd = 1.67 +/- 0.86 µM calculated as the mean +/- standard deviation of the returned values from each code using a global fit); the right plot shows curves for a negative control peptide.
