
Figure 1.
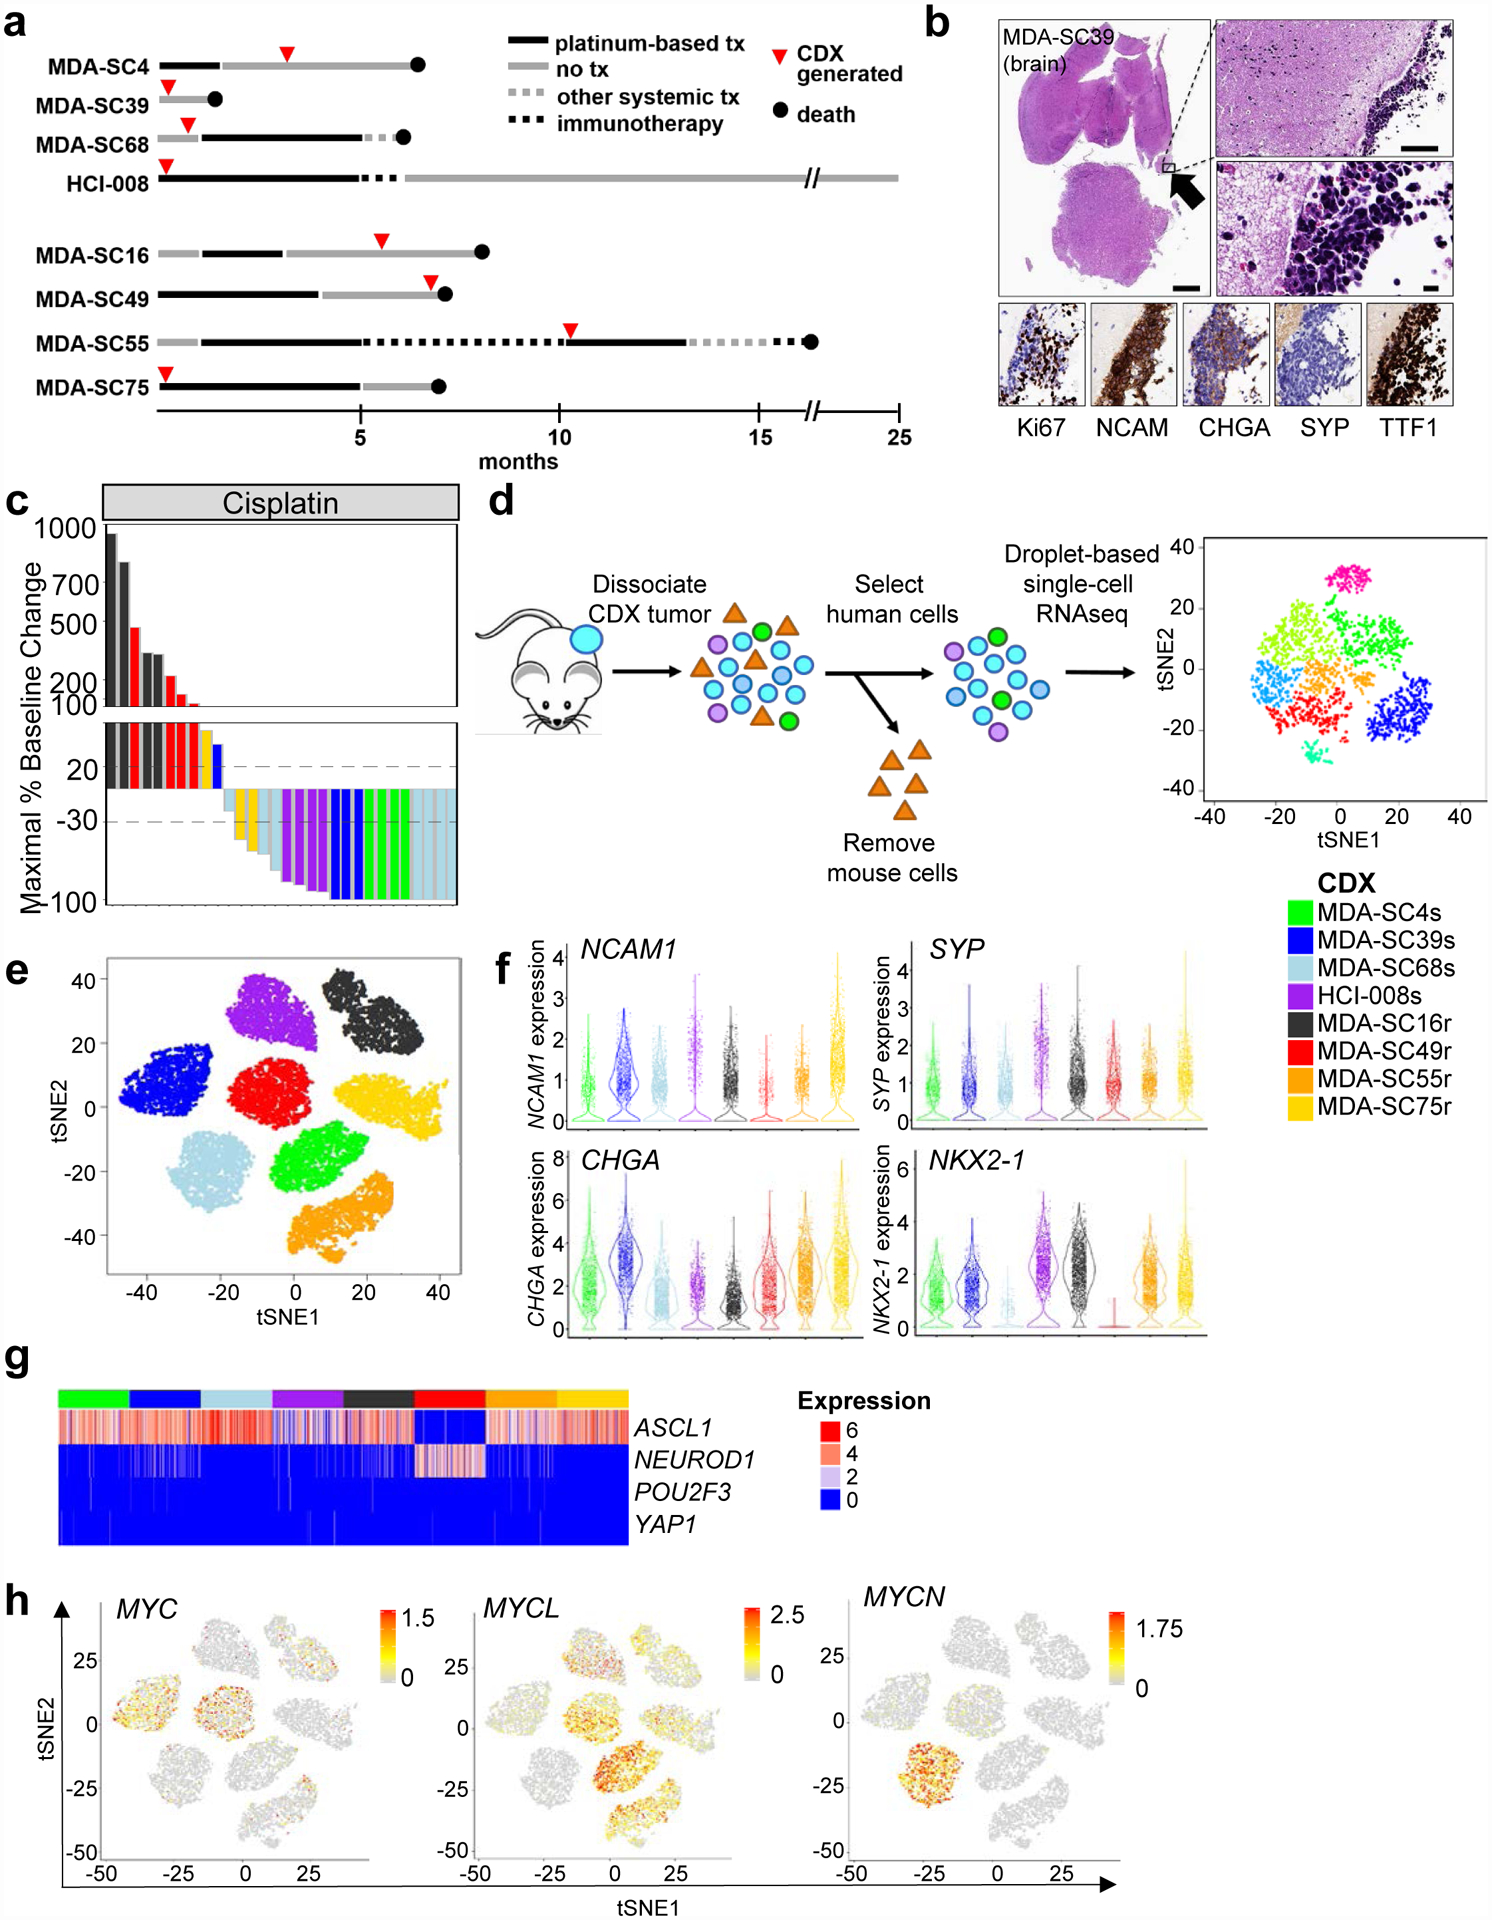
SCLC CDXs mimic patient disease at the single-cell transcriptional level and by platinum-response. a, Representation of patient clinical course including the time point at which blood was collected for CDX generation (red circles). Arrows indicate treatment and are drawn to scale. b, Histological images of leptomeningeal disease detected in MDA-SC39, including characterization of standard SCLC markers. The presence of leptomeningeal disease was detected in one of five mice whose brains were examined. Scale bars = 1mm, 100 μm, or 10 μm. c, Waterfall plot of maximal baseline change from treatment of CDXs with cisplatin. MDA-SC4s, MDA-SC39s, MDA-SC68s and HCI-008s are platinum-sensitive, while MDA-SC16r, MDA-SC49r, MDA-SC55r, and MDA-SC75r are platinum-resistant. d, Schematic describing method for performing single-cell RNAseq on CDXs. e, Cells from each CDX are more similar to themselves than to other models. t-SNE analysis of eight CDXs. f, Violin plots indicating range of expression of NCAM1, SYP, CHGA, and NKX2–1 (TTF1) in single cells from each CDX. Each dot represents one cell and the violin curve represent the density of the cells at different expression levels. g, Expression pattern of ASCL1/NEUROD1/POU2F3/YAP1 genes within each CDX. h, t-SNE feature plots showing heterogeneity of expression of MYC, MYCL, and MYCN in all CDXs. In e, f, and g n=2,000 cells.