
Extended Data Figure 6.
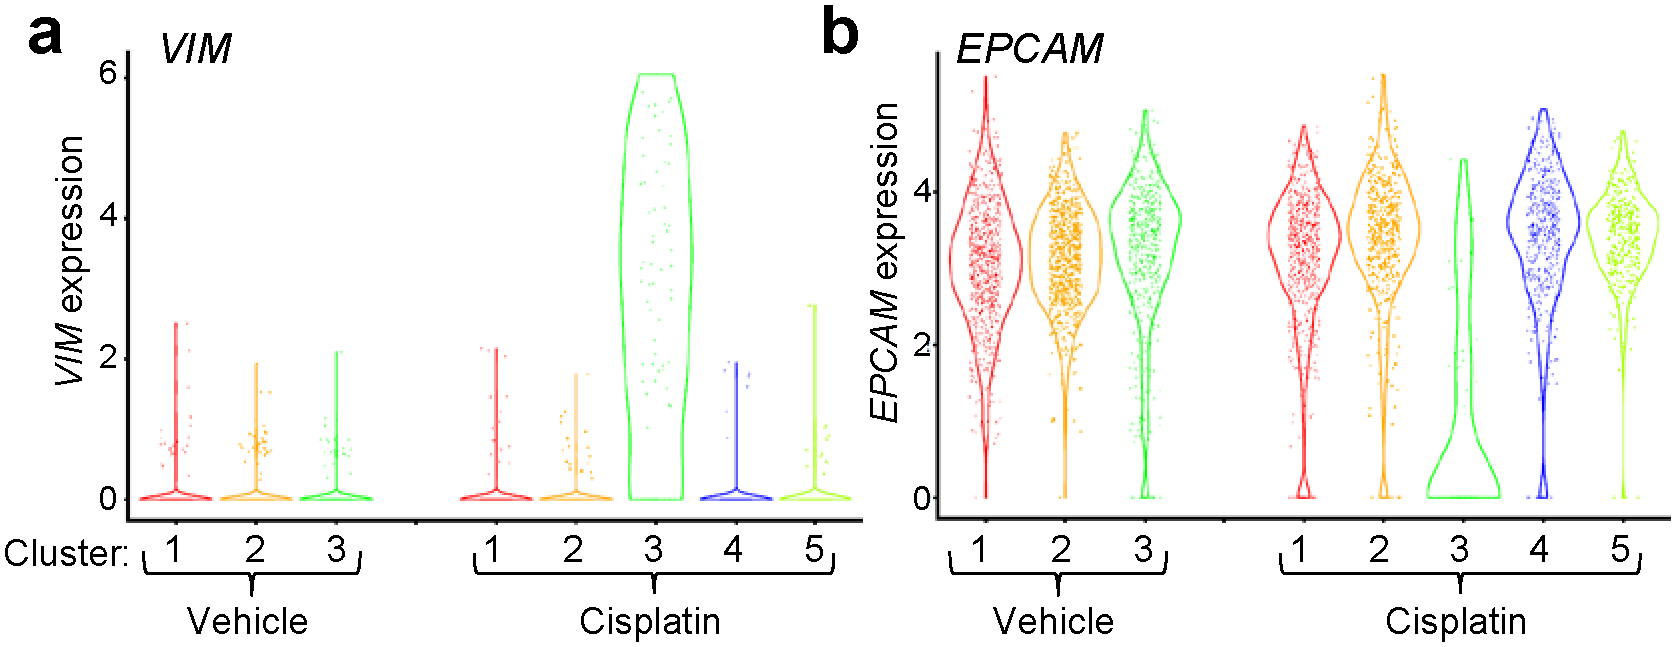
Emergence of a mesenchymal cell cluster following cisplatin-treatment. Violin plot of VIM (a) and EXPCAM (b) expression in the clusters of MDA-SC68s vehicle and cisplatin-treated CDXs. MDA-SC68 vehicle: n=733, 704, 563 cells for clusters 1–3; MDA-SC68 cisplatin: n=635, 489, 71, 467, 338 cells for clusters 1–5. Each dot represents one cell and the violin curve represent the density of the cells at different expression levels.