
Figure 3.
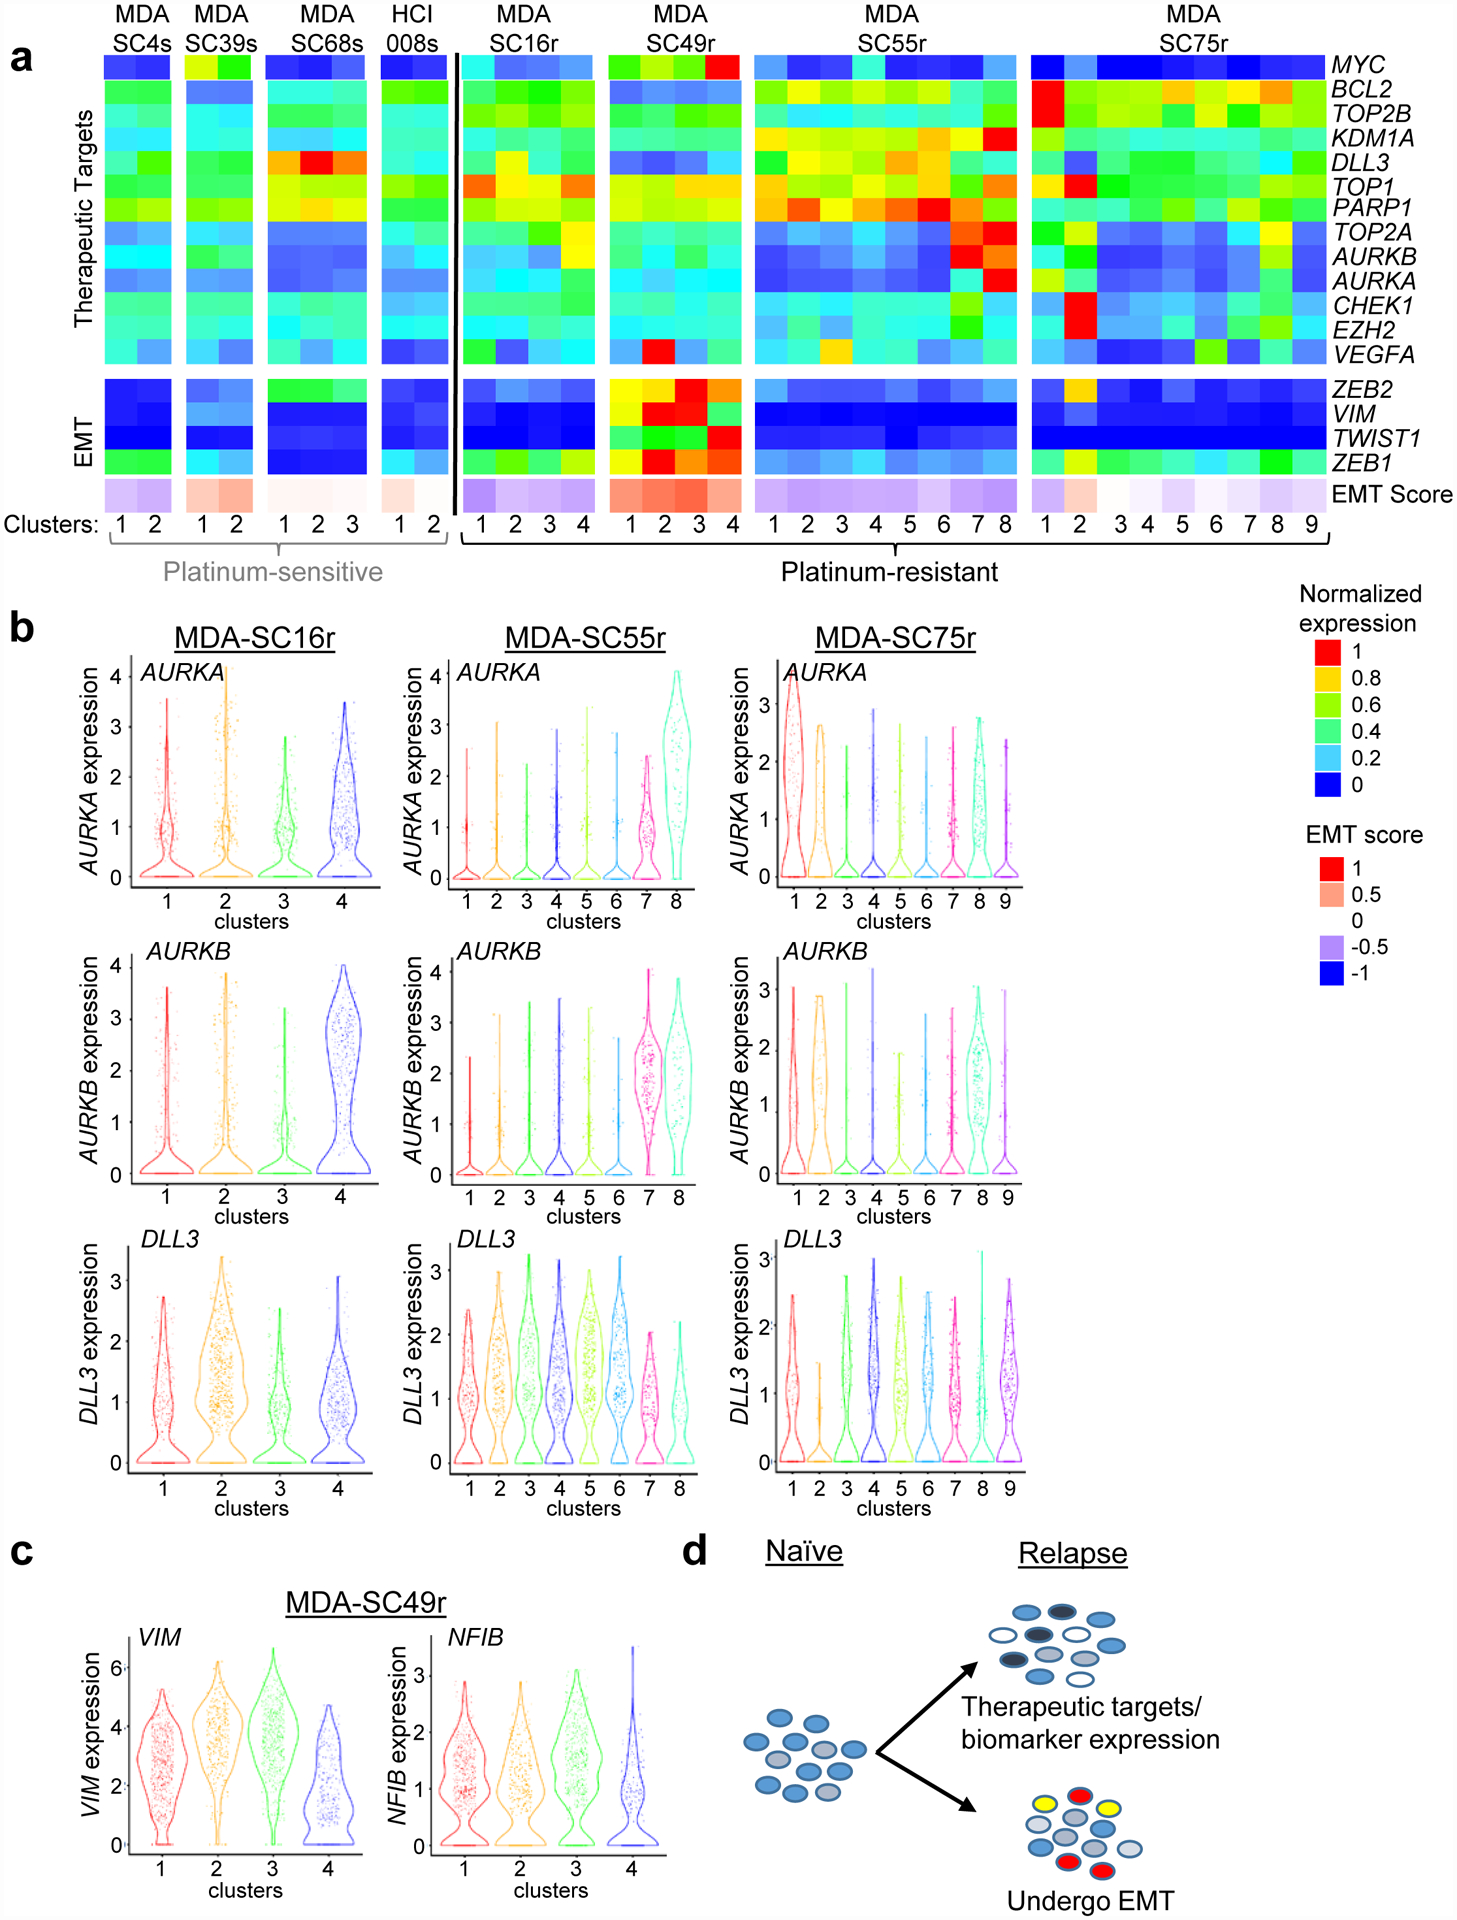
Platinum-resistance is associated with heterogeneous expression of therapeutic targets or EMT-related genes within specific clusters. a, Expression of specific therapeutic targets, EMT-related genes, or EMT score in the clusters from all eight CDXs. Little variation was detected in clusters from platinum-sensitive CDXs. b, Violin plots of expression of several therapeutic targets (AURKA, AURKB and DLL3) within clusters from three platinum resistant CDXs (MDA-SC16r, MDA-SC55r and MDA-SC75r). MDA-SC16r: n=438, 557, 554, 451 cells for clusters 1–4; MDA-SC55r: n=271, 216, 360, 365, 384, 190, 148, 66 cells for clusters 1–8; MDA-SC75r: n=109, 69, 228, 453, 233, 187, 296, 207, 218 cells for clusters 1–9. c, Violin plots of VIM and NFIB expression within individual clusters from MDA-SC49r. Each dot represents one cell and the violin curve represent the density of the cells at different expression levels. MDA-SC49r: n=683, 317, 652, 348 cells for clusters 1–4. d, Schematic indicating that changes in gene expression in the platinum-sensitive cells gives rise to variation in either therapeutic targets or EMT-related genes.