
Figure 4.
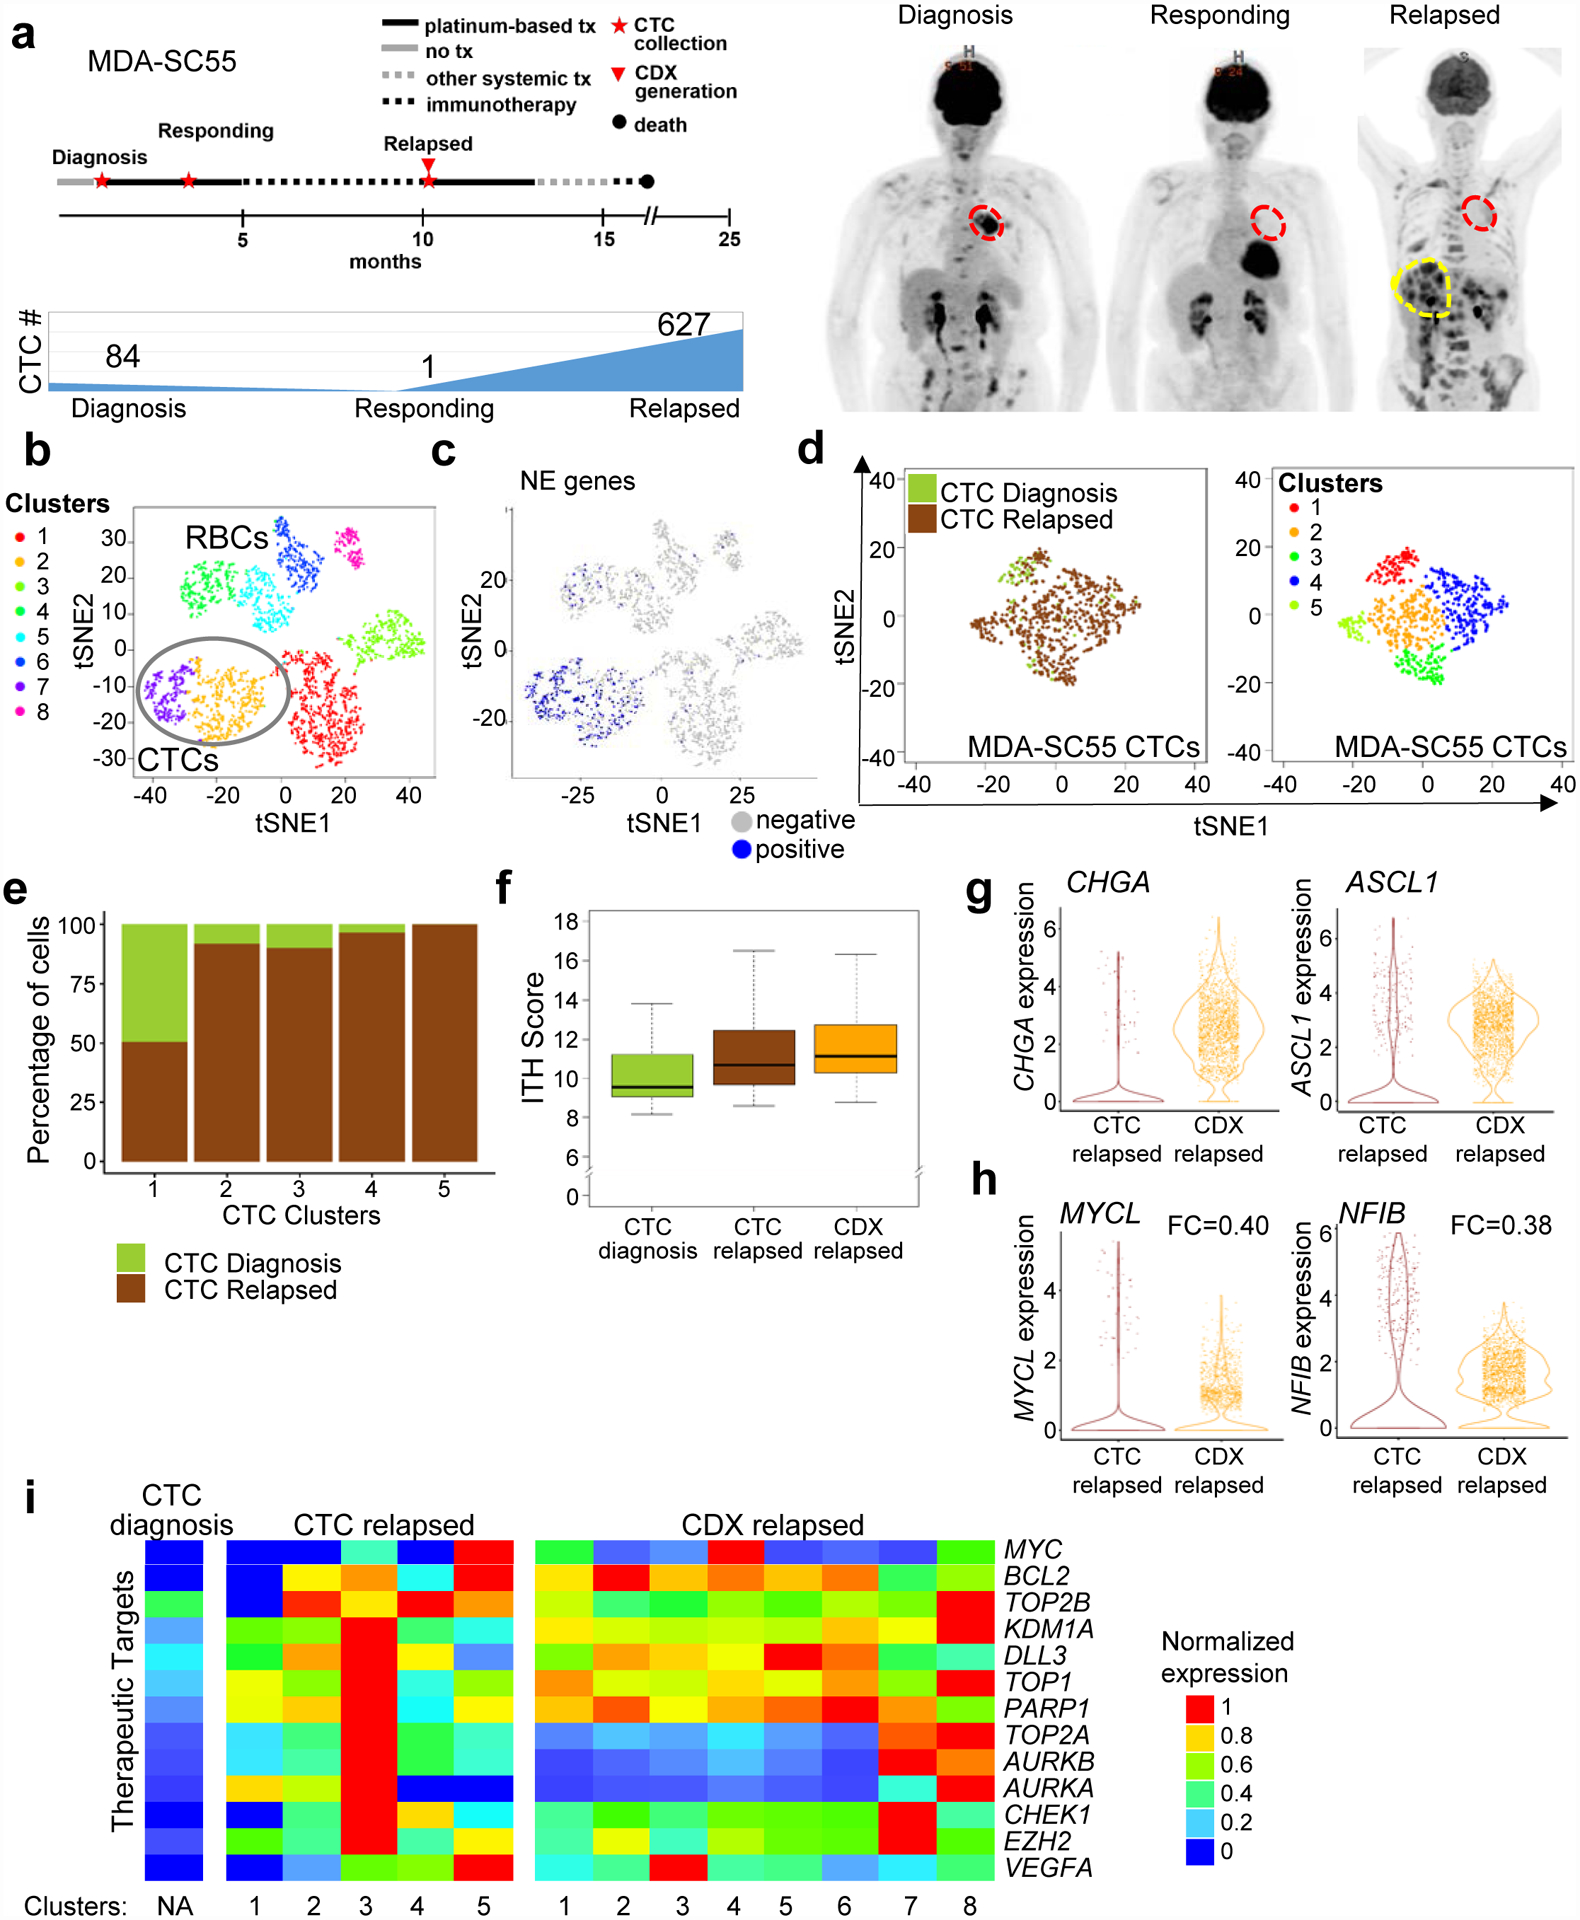
Serial single-cell RNAseq analysis of patient CTCs revealed similar transcriptional heterogeneity to a paired CDX. a, Representation of patient MDA-SC55 clinical course at the time blood was collected for CTC analysis and CDX generation. Patient MDA-SC55 body scans performed at the time blood was collected (red indicates lung primary tumor; yellow indicates liver metastases) and CTC numbers at the time of collection. These samples were collected from one patient along the course of treatment and represent an isolated collection at a specific time point. b, t-SNE plot of pooled MDA-SC55 cells at diagnosis, responding and relapsed time points revealed eight separate clusters, cluster 2 and 7 were identified as CTCs (circled). c, t-SNE plot of cells expressing NE genes to identify CTCs. d, t-SNE plots of all CTCs by time point (at diagnosis [green], and at relapse [brown]; left) and t-SNE visualization of CTC cell clusters from all time points (n=712 cells). e, Contribution of cells from the diagnosis or relapsed time points within each of the CTC clusters. f, CTCs and CDX cells from the relapsed time point have a higher ITH score by Kruskal–Wallis test than CTCs collected at diagnosis (diagnosis CTCs vs. relapsed CTCs and diagnosis CTCs vs. relapsed CDX, P=3.0e-17; diagnosis CTCs: n=84 cells). Center lines show the medians; box limits indicate the 25th and 75th percentiles; whiskers extend 1.5 times the interquartile range from the 25th and 75th percentiles. g, Violin plots of CHGA and ASCL1 expression in the relapsed CTCs and CDX cells. h, Violin plots depicting decreased expression of MYCL and NFIB in the CDX cells compared to CTCs at relapse by two-sided Wilcoxon rank-sum test (P<2.2e-16 for both). Each dot represents one cell and the violin curve represent the density of the cells at different expression levels. i, Expression patterns of therapeutic targets in clusters from the CTCs and CDX following relapse. CTCs were normalized separately from CDX cells. In b and c, n=2,719 cells. In f, g and h relapsed CTCs: n=627 cells, relapsed CDX: n=2,000 cells.