
Figure 5.
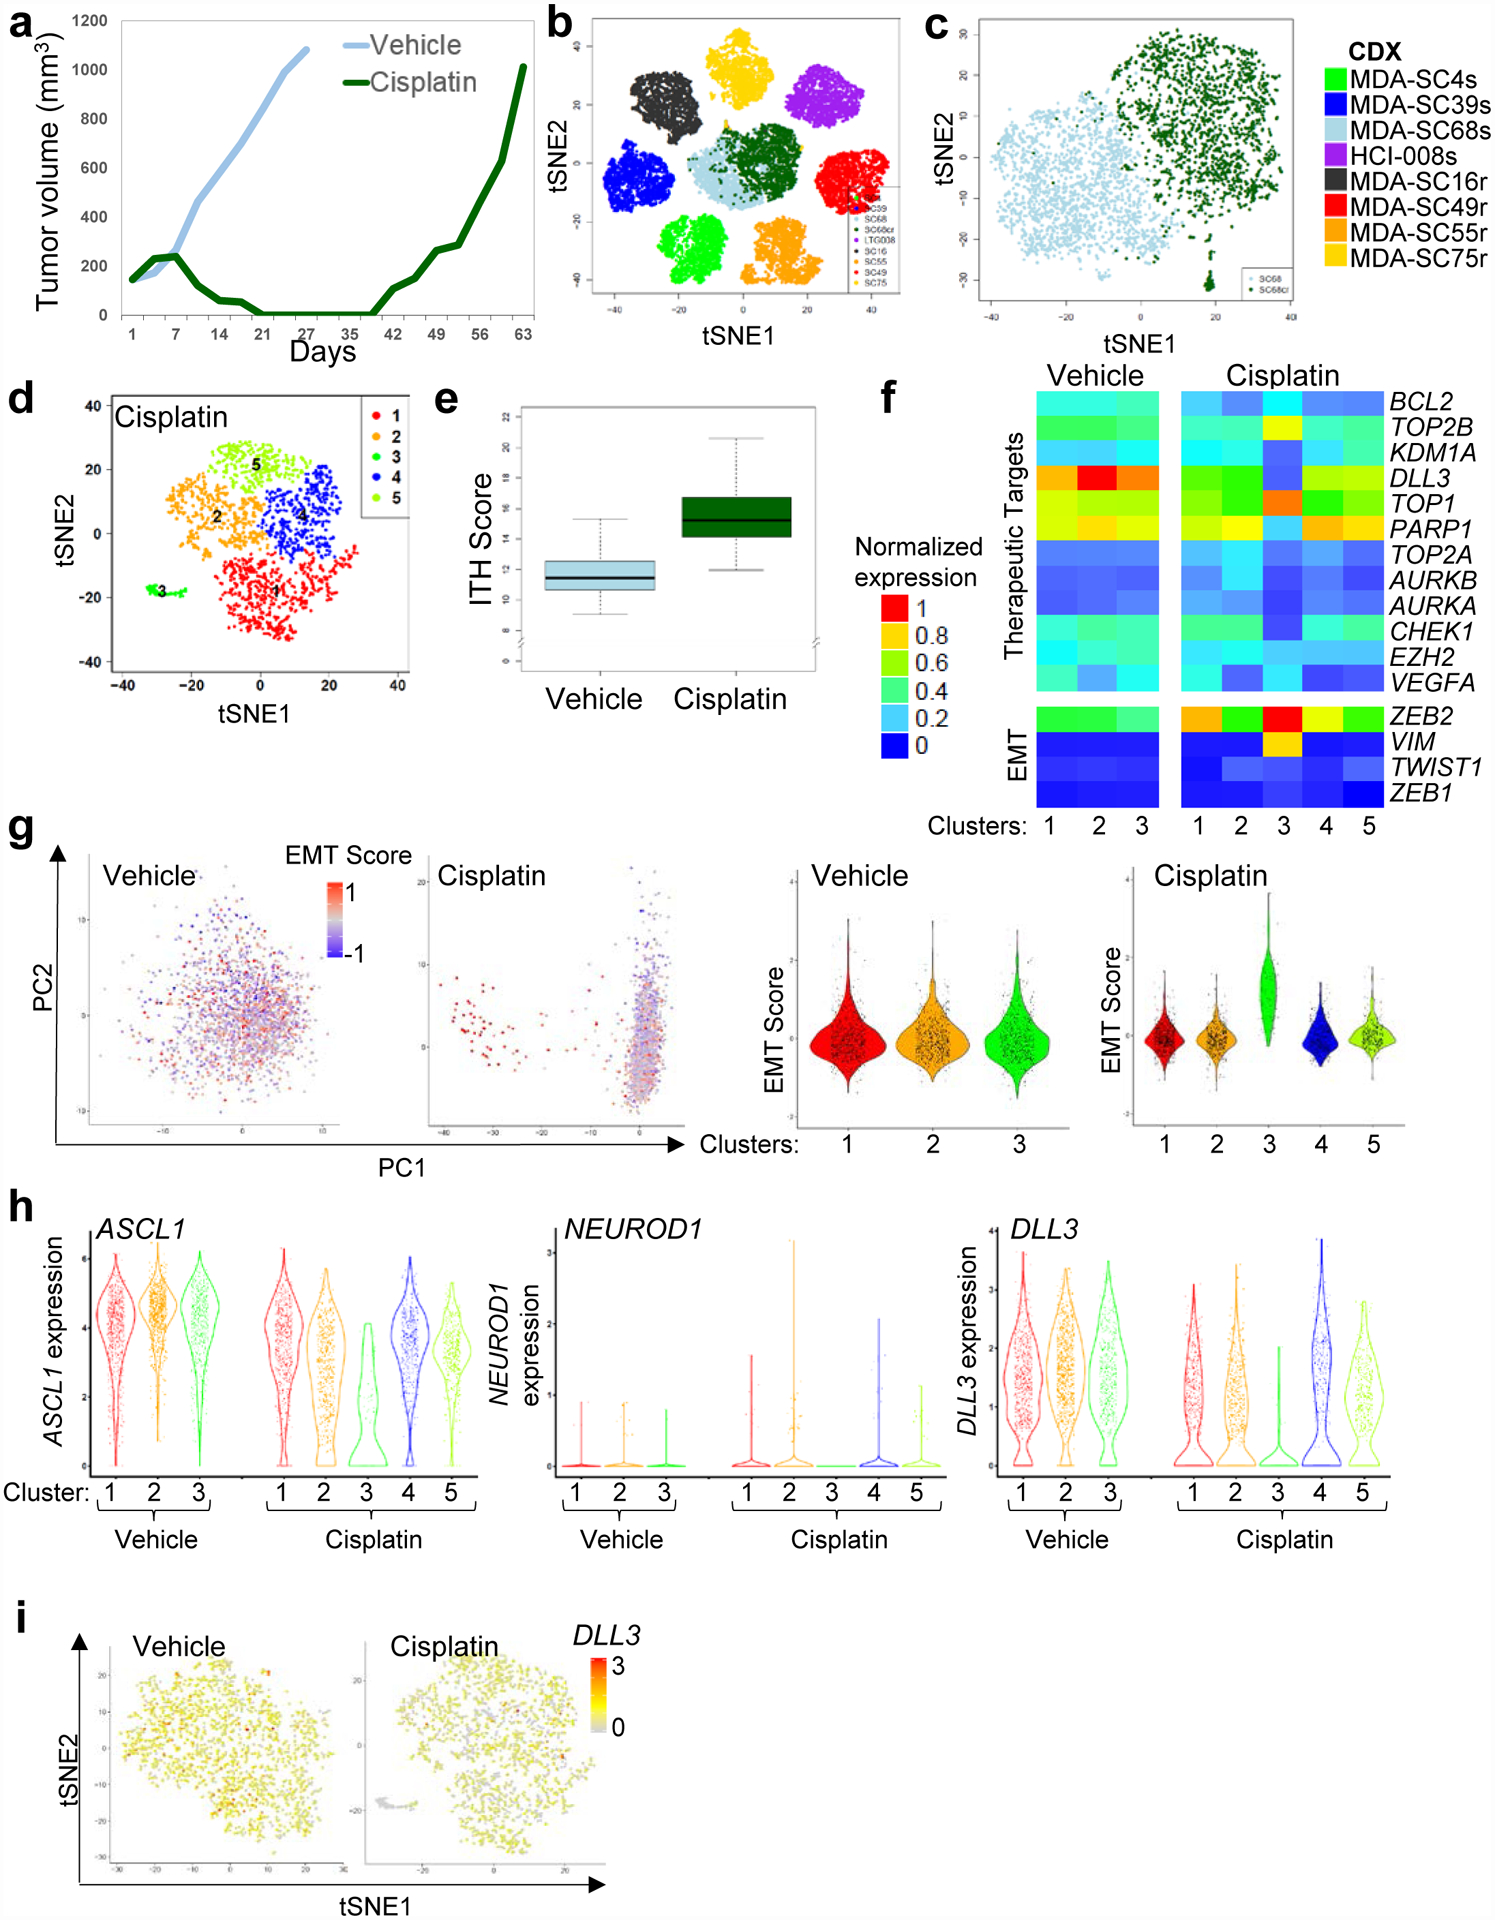
Increased ITH and emergence of cell populations with EMT signatures occur following cisplatin relapse. a, Tumor growth for MDA-SC68s vehicle or cisplatin-treated mice (n=1 per treatment). Tumors were collected when tumor volume reached approximately 1,000 mm2. b, Pooled t-SNE plot of the MDA-SC68s vehicle and cisplatin-treated tumors in combination with the seven other CDXs. c, t-SNE visualization of the MDA-SC68s vehicle and cisplatin-treated CDXs. d, t-SNE plot of cell clusters in cisplatin-relapsed MDA-SC68s cells. e, Cisplatin-treated cells have an increased ITH score compared to vehicle cells by two-sided Wilcoxon rank sum test (P<2.2e-16). Center lines show the medians; box limits indicate the 25th and 75th percentiles; whiskers extend 1.5 times the interquartile range from the 25th and 75th percentiles. f, Expression of specific therapeutic targets and EMT-related genes the clusters from vehicle or cisplatin-relapsed MDA-SC68s cells. g, Left panel: principal component analysis of MDA-SC68s cisplatin-treated cells identified the first component to be associated with EMT score in MDA-SC68s cisplatin-treated cells, but not in vehicle-treated cells. Violin plot of the EMT score of individual cells within each cluster indicate that cells with the highest EMT score were located in cluster 3 of the MDA-SC68s cisplatin-treated tumor. MDA-SC68 vehicle: n=733, 704, 563 cells for clusters 1–3; MDA-SC68 cisplatin: n=635, 489, 71, 467, 338 cells for clusters 1–5. h, Right panel: Violin plots of ASCL1, NEUROD1, and DLL3 expressions within the clusters from MDA-SC68s vehicle and cisplatin-treated tumors. ASCL1 and DLL3 were expressed at lower levels in the cisplatin-treated sample (P<0.0001 for each). MDA-SC68 vehicle: n=733, 704, 563 cells for clusters 1–3; MDA-SC68 cisplatin: n=635, 489, 71, 467, 338 cells for clusters 1–5. Each dot represents one cell and the violin curve represent the density of the cells at different expression levels. i, t-SNE visualization of DLL3 expression in vehicle and cisplatin-treated cells. In b, c, d, e, and i, n=2,000 cells each.