
Extended Data Figure 2.
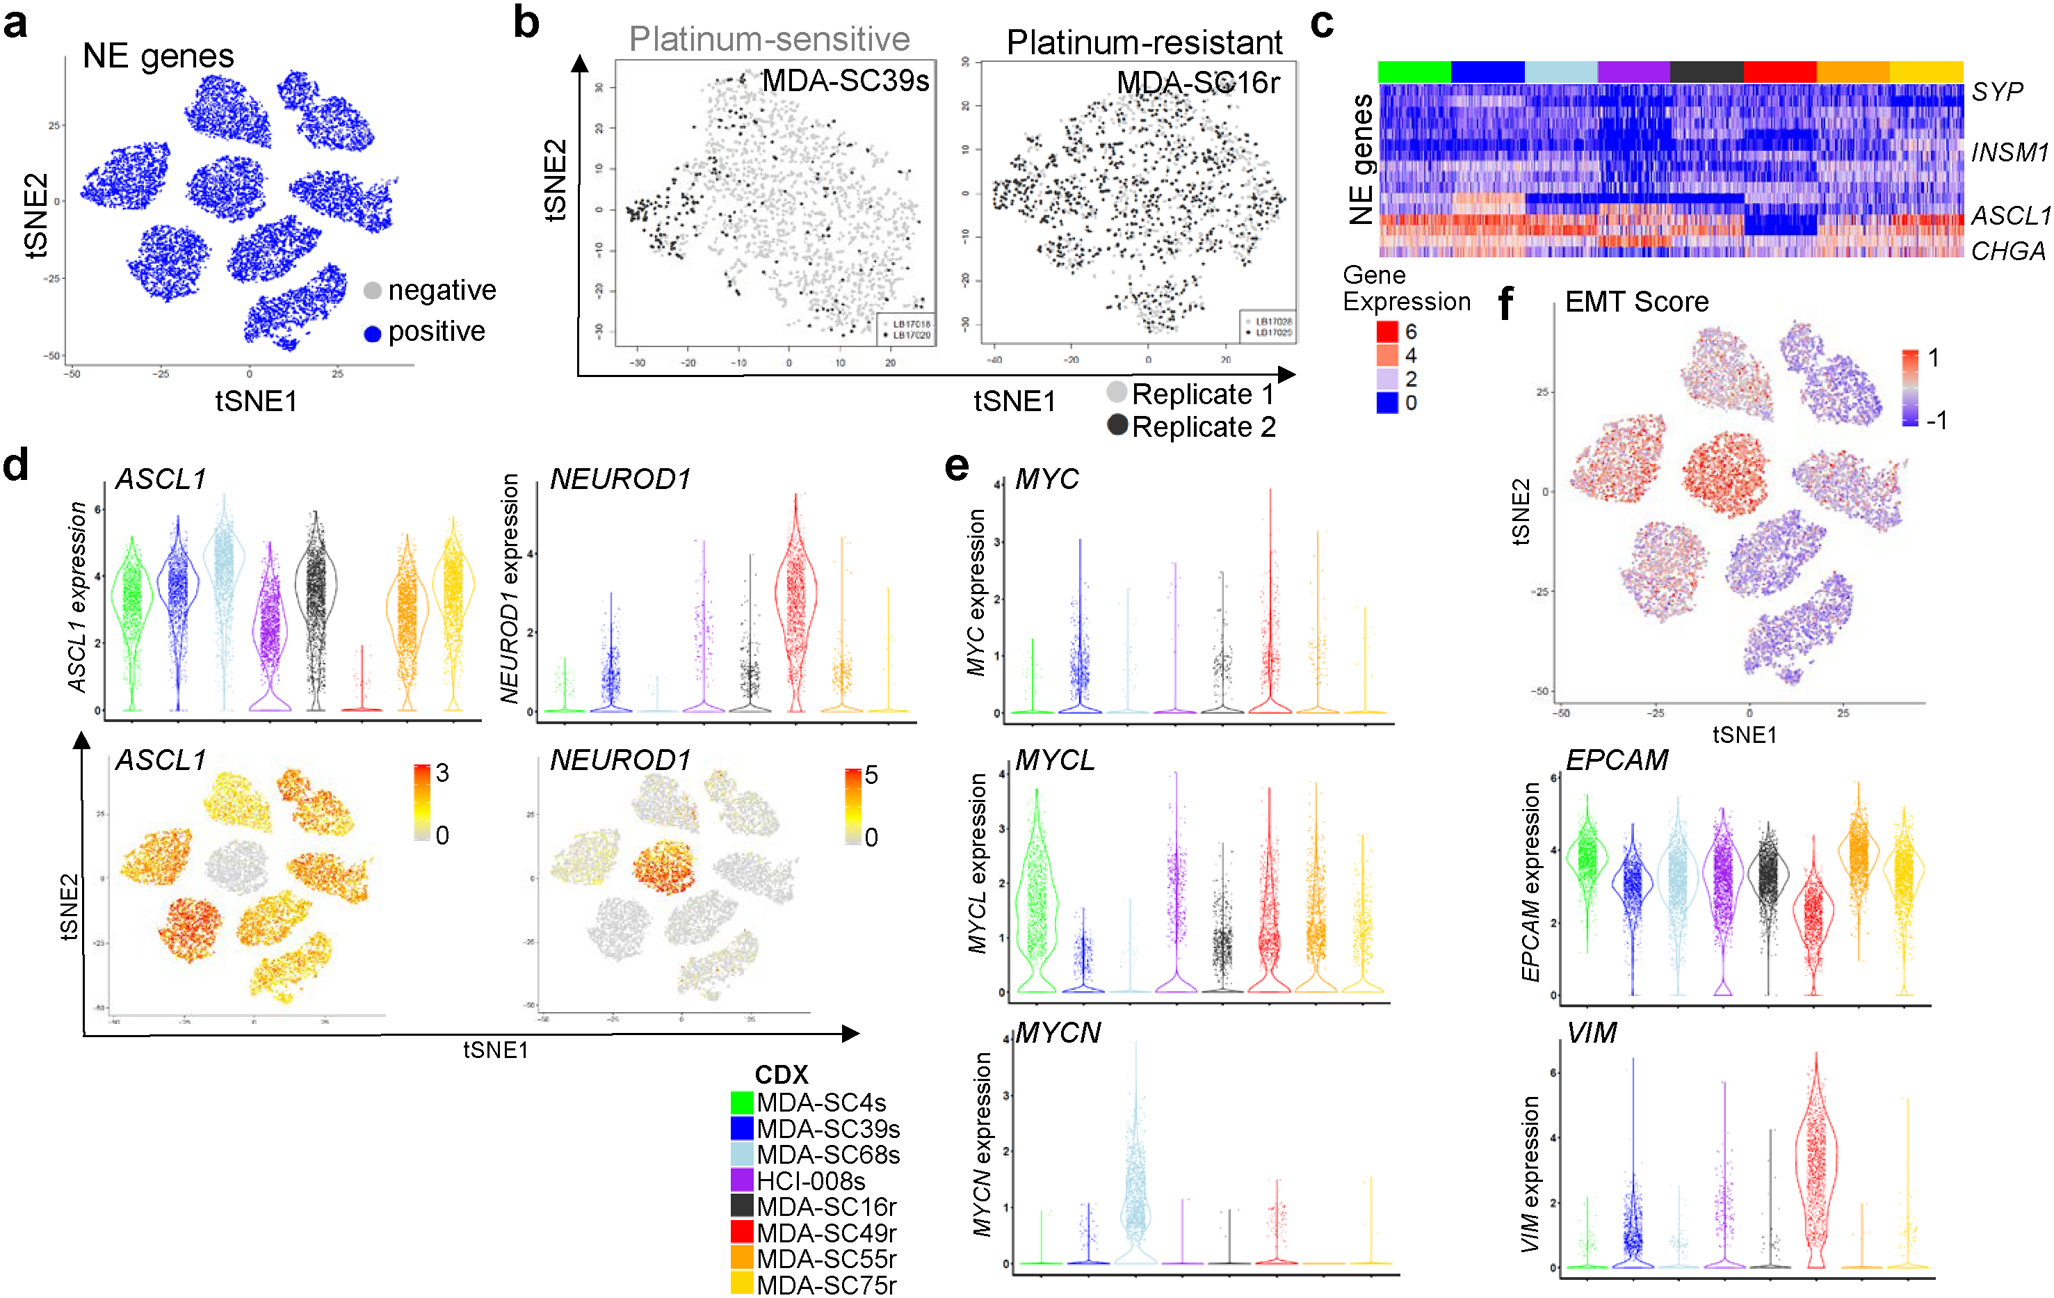
ITH among SCLC molecular subtypes. a, t-SNE visualization of NE gene expression status in all CDXs (n=2,000 cells each). b, t-SNE visualization of cell populations from biological replicates of MDA-SC39s and MDA-SC16r obtained from tumors grown in the same passage, but different mice. Note mixing of cell populations indicate that clustering is not due to variations in replicate (n=2,000 cells each). c, Heatmap analysis of NE gene expression indicating that all CDXs are considered high neuroendocrine subtypes. d, Expression of ASCL1 and NEUROD1 in all CDXs by both violin plot to indicate range in expression and feature plot to show abundance (n=2,000 cells each). e, Violin plots indicating expression of MYC family members in the CDXs (n=2,000 cells each). Each dot represents one cell and the violin curve represent the density of the cells at different expression levels. f, EMT score is elevated within MDA-SC39s and MDA-SC49r, which corresponds with increased expression of VIM and decreased EPCAM (n=2,000 cells each).