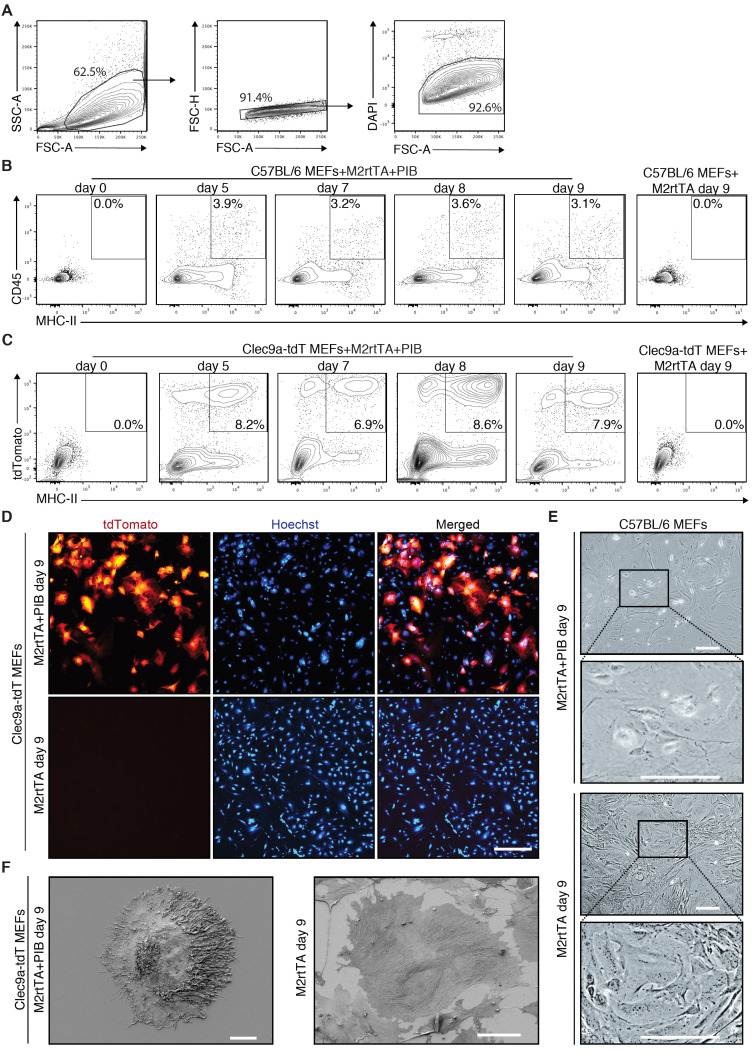
Figure 3. Flow cytometry and microscopy analysis of induced dendritic cells generated by direct reprogramming of mouse embryonic fibroblasts.
A. Gating strategy to analyze the emergence of induced dendritic cells (iDCs) by flow cytometry during reprogramming. Population was selected with FSC and SSC, followed by exclusion of doublets and dead cells (DAPI+). B. The emergence of CD45+MHC-II+ iDCs was quantified by flow cytometry 5 days (d5), 7 days (d7), 8 days (d8) and 9 days (d9) after induction of PU.1, IRF8 and BATF3 (PIB) in wild type (C57BL/6) mouse embryonic fibroblasts (MEFs). Transduced MEFs at Day 0 and M2rtTA-transduced MEFs at Day 9 were included as controls. CD45+MHC-II+ gating strategy was performed based on single-cell stainings for CD45 and MHC-II 9 days after induction of PIB in wild type MEFs. C. Flow cytometry analysis of tdTomato+MHC-II+ cells at d5, d7, d8 and d9 after induction of M2rtTA and PIB in Clec9a-tdT MEFs. Transduced MEFs at Day 0 and M2rtTA-transduced MEFs at Day 9 were included as controls. D. Immunofluorescence for tdTomato and Hoechst (blue) highlighting the emergence and frequency of tdTomato+ cells. M2rtTA-transduced MEFs at Day 9 were included as control. Scale bar = 500 μm. E. Bright-field micrographs of C57BL/6 MEFs 9 days after induction of M2rtTA or M2rtTA and PIB. Scale bars = 100 μm. F. Scanning electron microscopy analysis of a tdTomato+ cell 9 days after induction of M2rtTA and PIB in Clec9a-tdT MEFs. M2rtTA-transduced MEFs at Day 9 were included as control. Scale bars = 10 μm.

