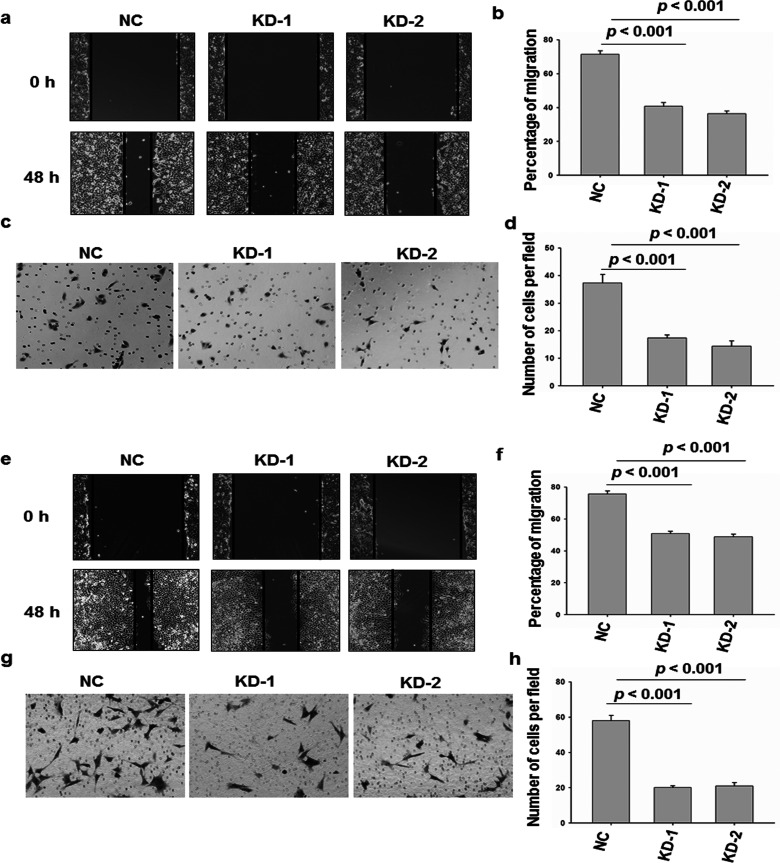
Figure 3.
Migration and invasion assay of legumain knockdown HeLa cells. (a, b) Cell migration analysis of HeLa cells of legumain knockdown or control. (c, d) Transwell invasion analysis of the same cell described in (a). Images are representative of three independent experiments. (e, f) Cell migration analysis of HeLa cells of legumain knockdown or control. (g, h) Transwell invasion analysis of the same cell described in (e). Images are representative of three independent experiments. Values are mean ± SEM.

