Figure 1.

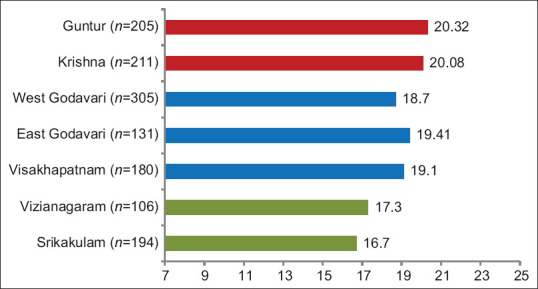
Differences in CAS-7 scores based on place of residence (CAS-7 scores <18 – Green; >18 < 20 – Blue; >20 – Red). *14 participants from districts other than those described in this figure were removed from the bar chart

Differences in CAS-7 scores based on place of residence (CAS-7 scores <18 – Green; >18 < 20 – Blue; >20 – Red). *14 participants from districts other than those described in this figure were removed from the bar chart