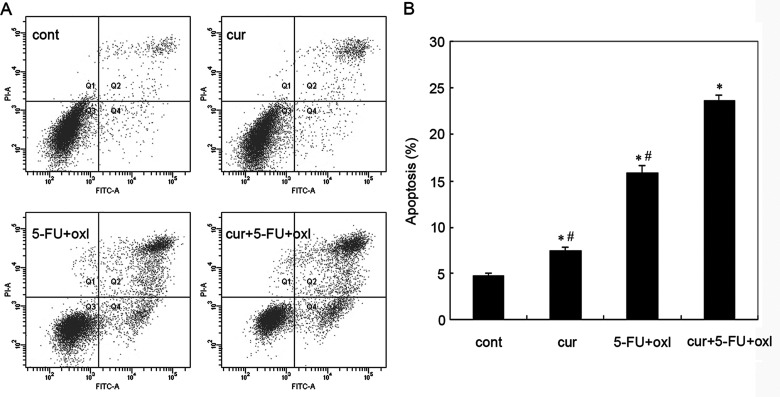
Figure 2.
Assessment of apoptosis of BGC-823 cells treated with curcumin (10 µM), FOLFOX [5-FU (0.1 mM) and oxaliplatin (5 µM)], or FOLFOX + curcumin. (A) Flow cytometric analysis of each group of BGC-823 cells stained with Annexin V-FITC and PI. Representative dot plots illustrating apoptotic status in BGC-823 cells. (B) The percentage of BGC-823 cell apoptosis. Data are expressed as mean% ± SD of each group of cells from three separate experiments. *Statistically significant values compared to control (p < 0.01); #statistically significant values compared to FOLFOX + curcumin (p < 0.01).

