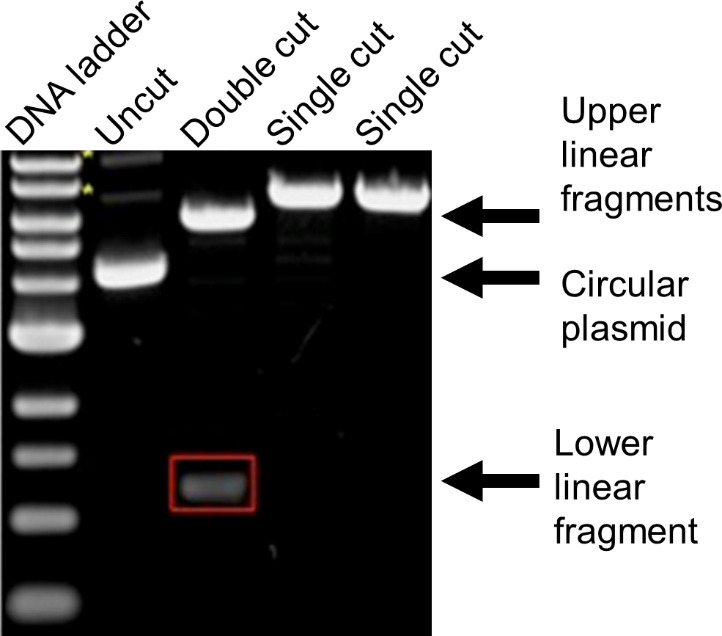
Figure 17. Image of digested and undigested plasmid DNA migration in agarose gel electrophoresis.

Lane 1 shows the DNA ladder and lane 2 shows the plasmid in its native state (i.e., no restriction digest). Lane 3 shows a plasmid that has been digested with two different restriction enzymes. When each enzyme cuts only one site in the plasmid, this results in two fragments. The upper band needs to be excised and purified and then used to assemble your new plasmid. The lower band is the fragment that needed to be removed from your plasmid prior to assembly. Lanes 4 and 5 show plasmids that have been digested with a single restriction enzyme. Note that circular DNA (lane 2) travels through the agarose gel faster than linear DNA (lanes 4 and 5) even when they are equivalent size. Image adapted from Addgene (https://blog.addgene.org/plasmids-101-how-to-verify-your-plasmid).
