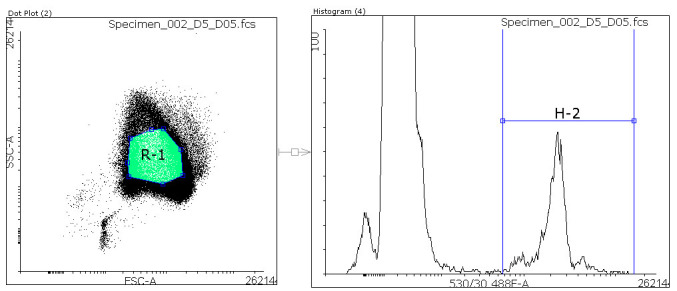
Figure 4. Gating of flow cytometry data.

Within the Dot Plot a region (R1, green) defines red blood cells. All cells within that region are analyzed within a Histogram. In the Histogram a region (H-2) is defined to separate parasites from uninfected red blood cells (RBCs). The ratio of Parasite/total RBCs ((H-2/R1)*100) is calculated to give the parasitemia.
