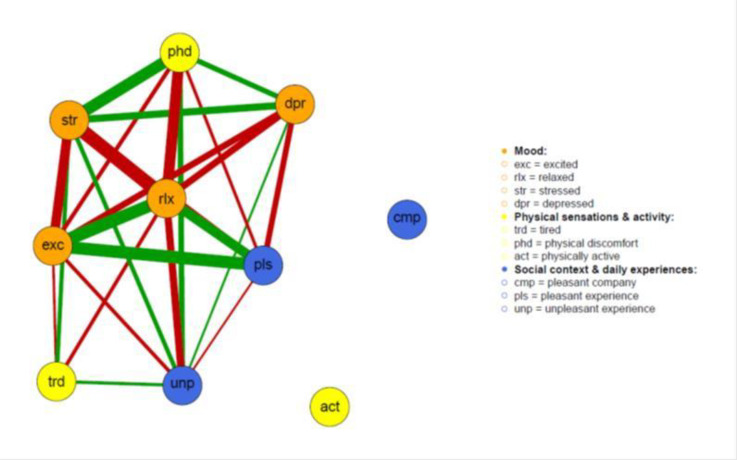
Figure 3.
Network graphs from personalized feedback report, depicting contemporaneous associations of nodes (i.e. across three-hour time lags). The color of the nodes represents variable categories: orange for affect (exc: excited, rlx: relaxed, str: stressed, dpr: depressed), yellow for somatic (trd: tired, phd: physical discomfort, act: physically active), and blue for context (cmp: pleasant company, pls: pleasant experience, unp: unpleasant experience). The colors of the lines represent either a positive (green) or negative (red) connection between two nodes. The thickness of the lines represents the weight of the connection: the thicker the line, the stronger the association.

