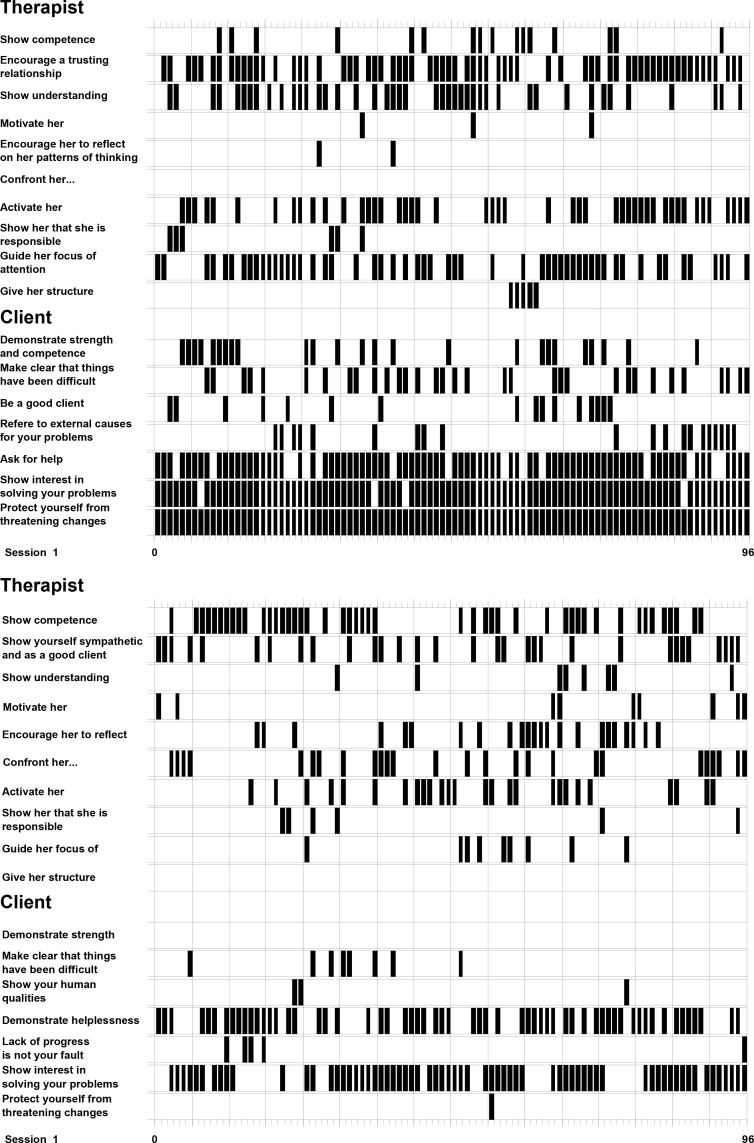
Figure 2.
Score of Plan Activation Patterns
The figure shows sequences of plan activations of second-level plans from the first session of Therapy I (above) and Therapy II (below). Every black box indicates the activation of a second-level plan. The duration for each column is 10 seconds. Clear differences in the activation patterns are visible to the naked eye. Especially the difference in the secondlevel plan ‘Protect yourself from threatening changes’ is striking. The naming of plans is shortened in the figure.

