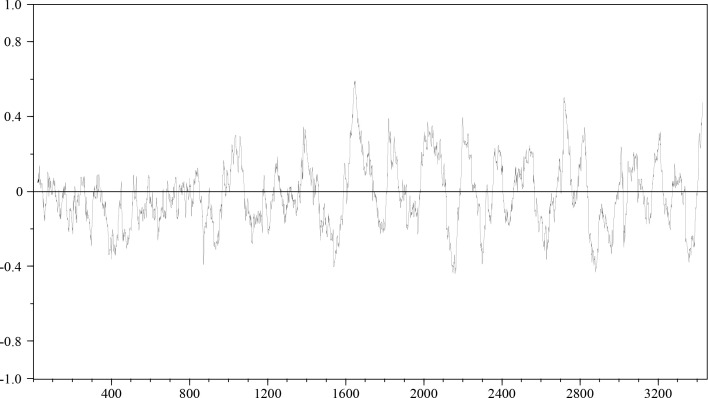
Figure 4.
Changing Correlations between Therapist and Client
The figure shows the course of the correlation between the self-representation category of the therapist ‘I. Encourage trust / create secure atmosphere’ and the client’s self-representation category ‘III. Problem-oriented work (self-relatedness vs. avoidance)’ of Therapy I (cf. Figure 3a), each calculated for a window of 50 measurement points. The calculation window is moved by one data point after each calculation, resulting in a correlation timeseries which is shorter than the original time-series. The correlation time-series is therefore centered in the figure (it starts later and ends earlier. Relatively high positive and high negative correlations are clearly visible, but no simple trend or pattern can be detected.

