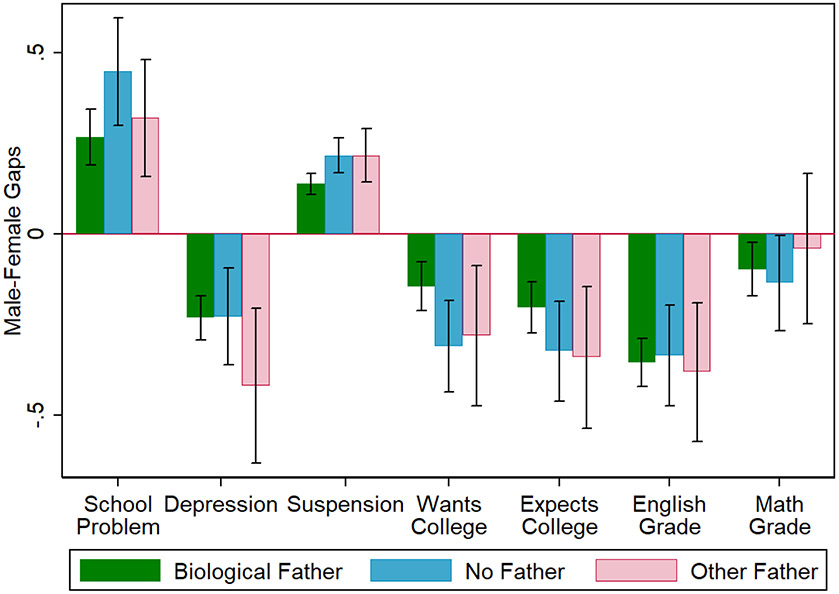
Figure 1: Gender Gaps in Adolescent Outcomes by Family Structures, Add Health Non-Hispanic White Sample.
Note: This figure displays the coefficient of “Male” dummy, when regressing the outcomes on “Male” dummy and a constant, with its 95% confidence interval. “No Father” and “Other Father” refer to living arrangements at Wave I. “School problems” is a standardized index based on factor analysis of the variables in Table A5. “Depression” is a standardized index based on factor analysis of the variables in Table A6. Grades are student-reported and range from 1=D or lower to 4=A. College desires/expectations are standardized measures based on a 0-4 scale. All models are weighted by Wave I weights.

