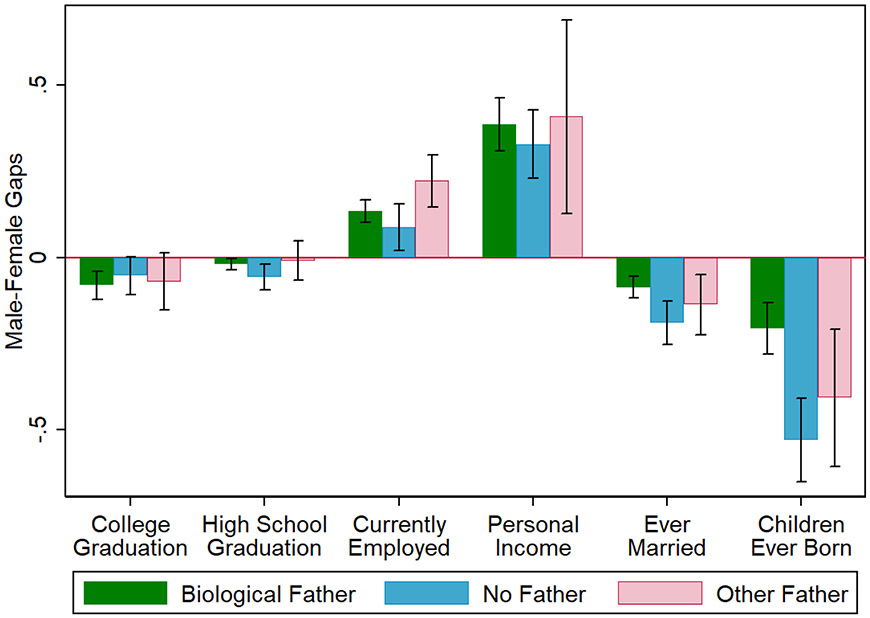
Figure 2: Gender Gaps in Adult Outcomes by Family Structures, Add Health Non-Hispanic White Sample.
Note: This figure displays the coefficient of “Male” dummy, when regressing the outcomes on “Male” dummy and a constant, with its 95% confidence interval. “No Father” and “Other Father” refer to living arrangements at Wave I. “Currently Employed” is a dummy for whether is currently working at Wave IV. “Personal Income” is the total personal earnings before tax in 2006/2007/2008. “Ever Married” is a dummy for whether has been married up to Wave IV. “Children Ever Born” is the self-reported total number of child births up to Wave IV. All models are weighted by Wave IV weights.

