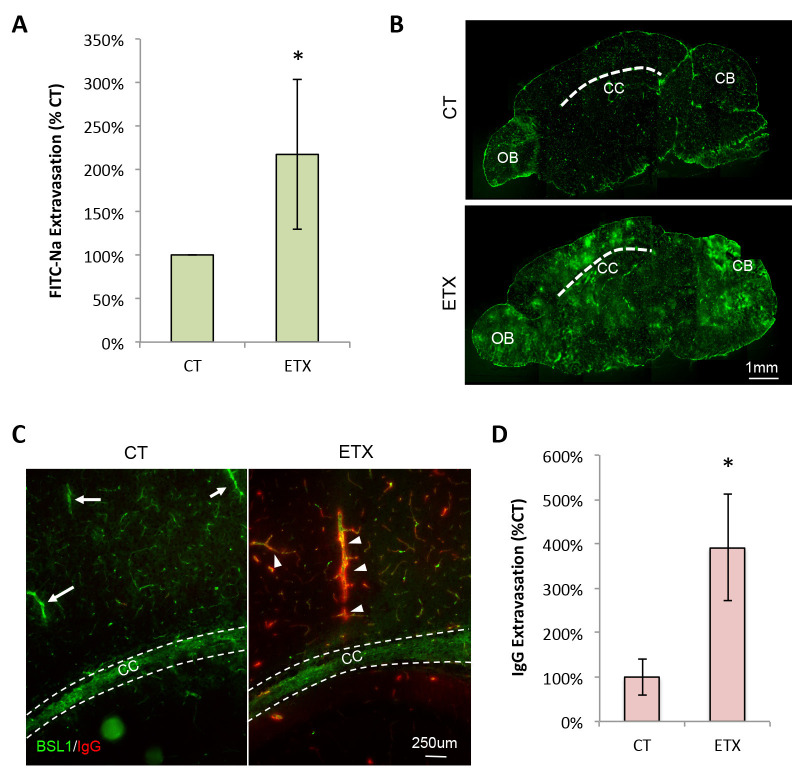
Figure 2. Representative evaluation of BBB permeability using the described methods.
Results reprinted from Linden et al., 2019 . Mice were treated with ETX or saline (CT) as described. A. BBB permeability assessed using FITC-Na as a tracer followed by brain homogenization and FITC-Na measurement via spectrophotometry. *Results expressed as mean ± STDEV, P < 0.05 determined by unpaired t-test. B. Micrographs of BBB permeability accessed using 70 kDa FITC-dextran and fluorescent microscopy. Sections are approximately 1.5 millimeters to the left of the mid-sagittal plane. Dashed line identifies corpus callosum (CC). OB, olfactory bulb. CB, Cerebellum. C. Micrographs of BBB permeability accessed by endogenous IgG (red) staining. Sagittal sections of PBS only perfused animals. FITC-BSL1 (green) is used to identify microvasculature. Dashed lines identify width of corpus callosum (CC). White arrows indicate large vessels with no observable IgG extravasation. White arrowheads indicate areas of IgG extravasations around large vessels. D. Semi-quantitative measurements of IgG extravasation in control and ETX treated mice, measured by fluorescent intensity. *Results expressed as mean ± STDEV, P = 0.05 determined by unpaired t-test.

