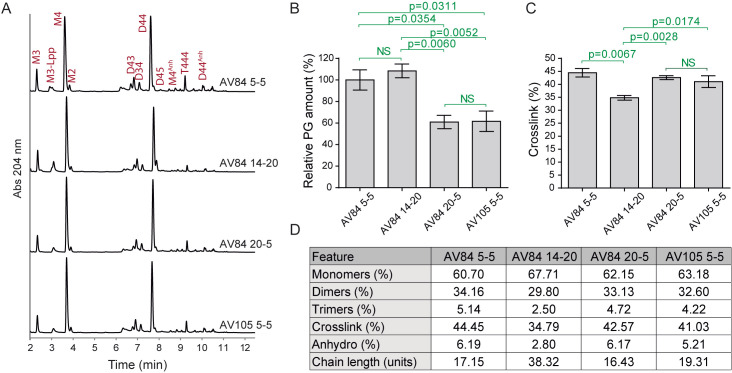
Figure 3. Peptidoglycan analysis of Escherichia coli samples with different repression levels of PBP1b and/or PBP1a.
A. Representative UPLC profiles. Identified muropeptides are indicated. B. Relative PG amount (compared to AV84 5-5). C. Percentage of crosslink. Calculated as: dimers + (trimers × 2). D. Main PG features showing relative molar abundance of monomers, dimers and trimers, overall crosslink values, relative molar amount of anhydro muropeptides and estimated chain length. Statistical analysis: unpaired t-test. NS: not significant. Data represents mean ± SEM, 3 replicas. Data modified from Vigouroux et al., 2020 .

