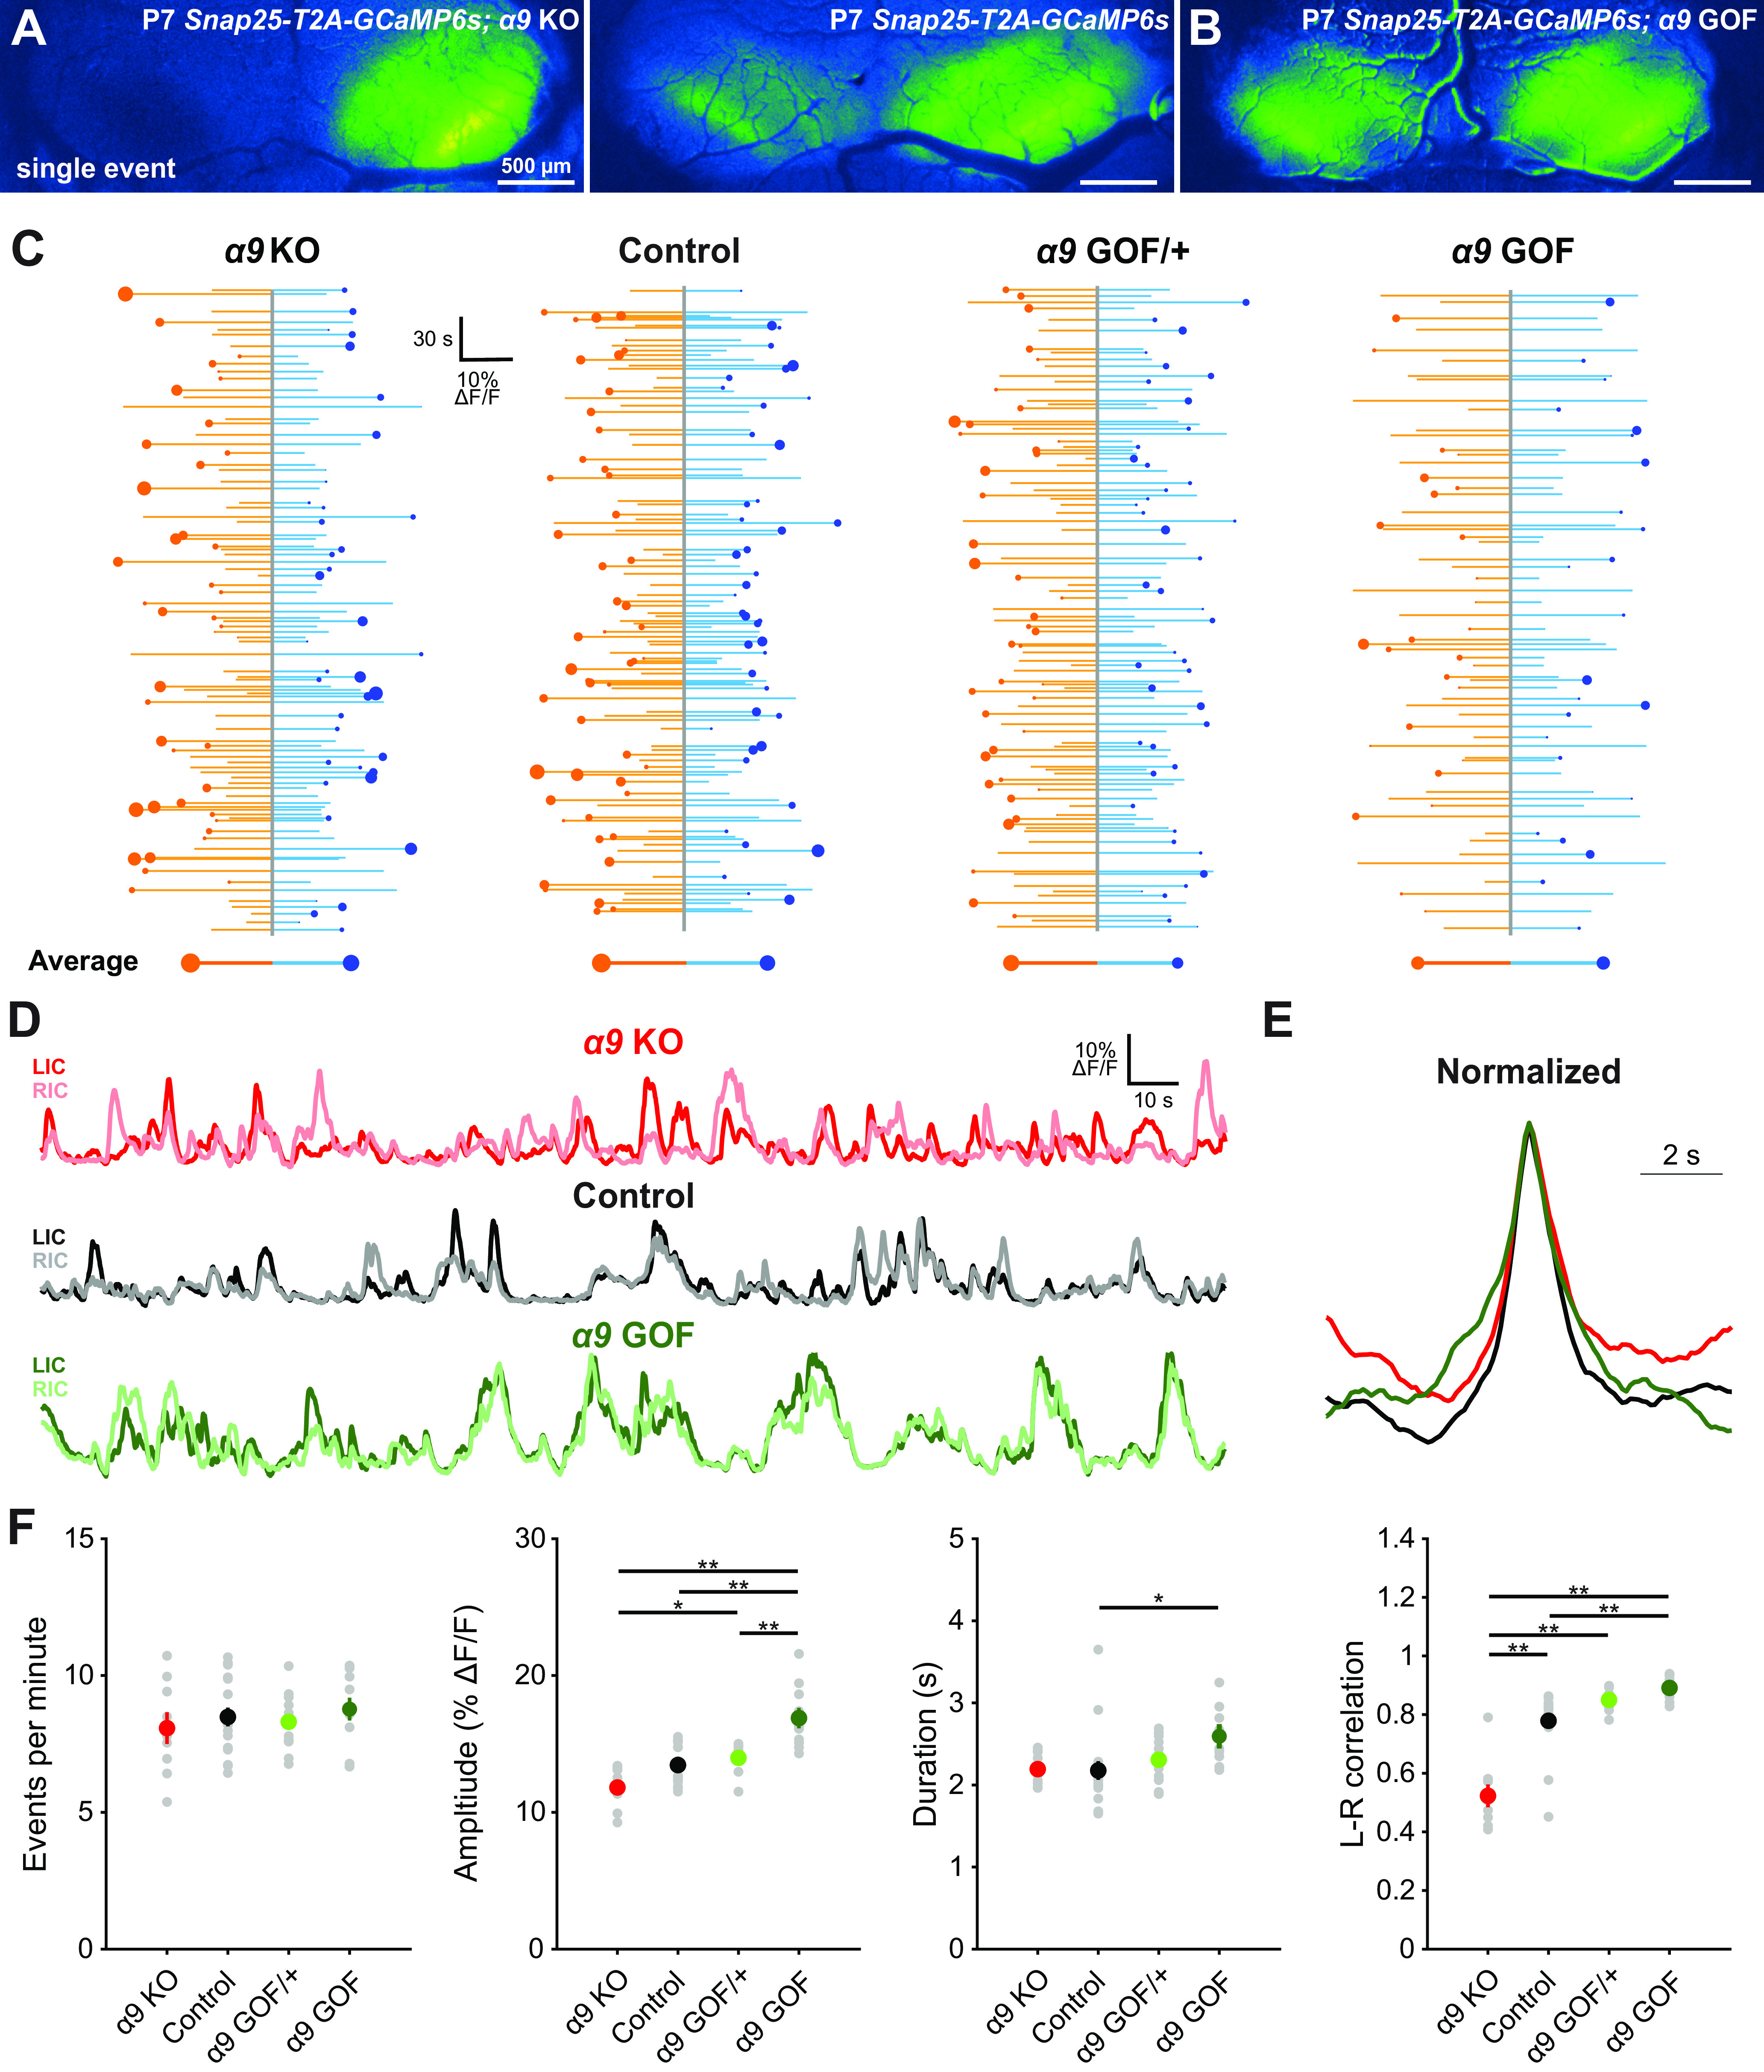
Figure 11.

Cholinergic modulation of IHCs influences correlated activation of IC neurons before hearing onset. A, Exemplar spontaneous Ca2+ transient in the auditory midbrain (IC) of unanesthetized Snap25-T2A-GCaMP6s; Chrnα9–/– (α9 KO) and Snap25-T2A-GCaMP6s (control) mice at P7. B, Exemplar spontaneous Ca2+ transient in the auditory midbrain (IC) of unanesthetized Snap25-T2A-GCaMP6s; Chrnα9L9'T/L9'T (α9 GOF) mice (P7). C, Graphs of activity over time for left (orange) and right (blue) lobes of the IC for indicated genotypes. Each line indicates an individual event. Circle represents which side had the greater intensity. Size of dots indicates the difference in fluorescence between the two sides. Bottom, Average event for each lobe of the IC. Size of circle is the average difference in the fluorescence between the two sides. D, Example fluorescence traces for indicated genotypes. E, Average event from traces shown in D normalized to amplitude. F, Quantification of event frequency, amplitude, duration, and left-right correlation coefficient (Pearson) across indicated genotypes. n = 9 α9 KO, n = 17 control, n = 13 α9 GOF/+, and n = 10 α9 GOF mice. **p < 0.005; *p < 0.05; one-way ANOVA with Tukey post hoc. Comparisons not shown are not statistically significant.
