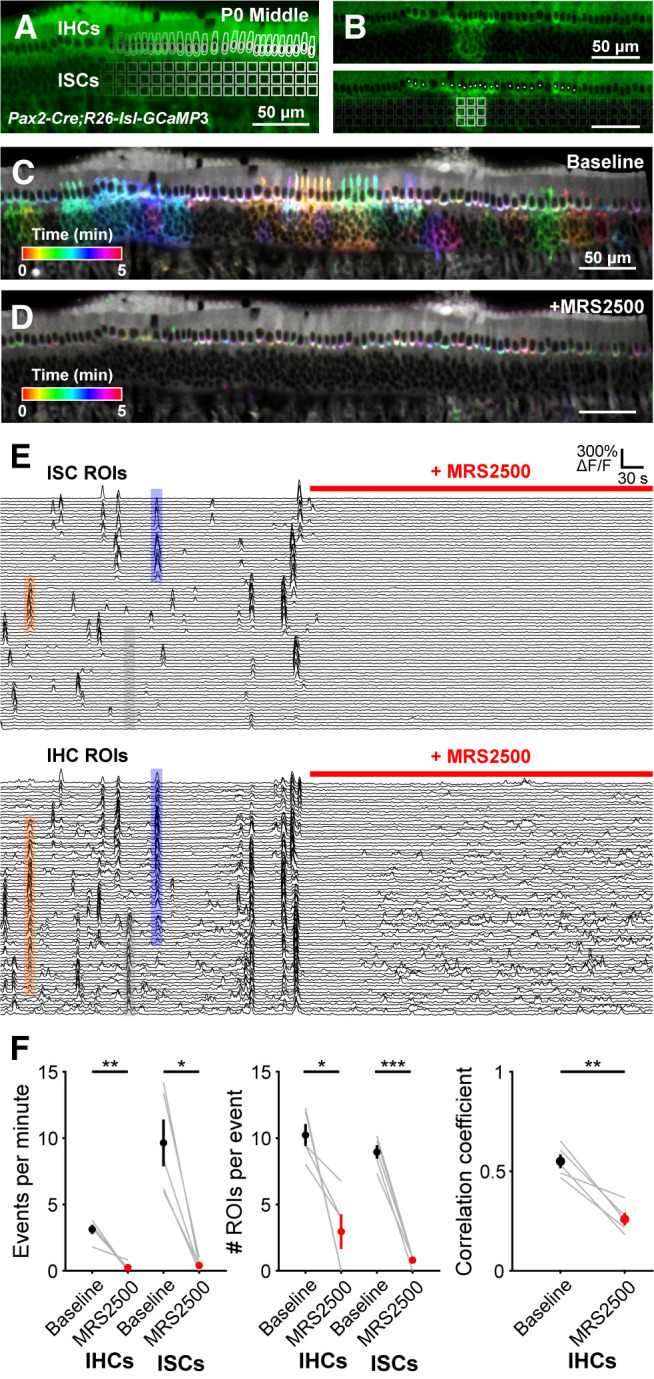
Figure 5.

Correlated activation of IHCs and ISCs requires P2RY1 signaling. A, Image of an excised cochlea (middle turn) from a P0 Pax2-Cre;R26-lsl-GCaMP3 mouse. For analysis of time-lapse imaging, a grid of square ROIs was placed over the ISCs and single ROIs were drawn for each IHC. Imaging was performed at near physiological temperature (32°C-34°C). B, Exemplar Ca2+ transient in ISCs and simultaneous activation of multiple IHC. Bottom, Circles represent active IHCs. White squares represent active ISCs. C, Ca2+ transients in control (baseline) conditions colored based on time of occurrence. D, Ca2+ transients with P2RY1 inhibited (MRS2500, 1 μm) conditions colored based on time of occurrence. E, Individual ROI traces for ISCs (top, 100 randomly selected) and IHCs (bottom, all shown). Colored boxes are examples of coordinated activity of ISCs and IHCs. The number of IHCs activated can extend far beyond area of ISC activation (see Fig. 6). Gray box represents IHC activation on the edge of the frame with no ISC activation, likely caused by an out-of-frame ISC event. F, Quantification of coordinated event frequency, number of ROIs per coordinated event, and the correlation coefficient before and after application of MRS2500. n = 5 cochleae from 3 mice. ***p < 5e-4; **p < 0.005; *p < 0.05; paired t test with Benjamini-Hochberg adjustment.
