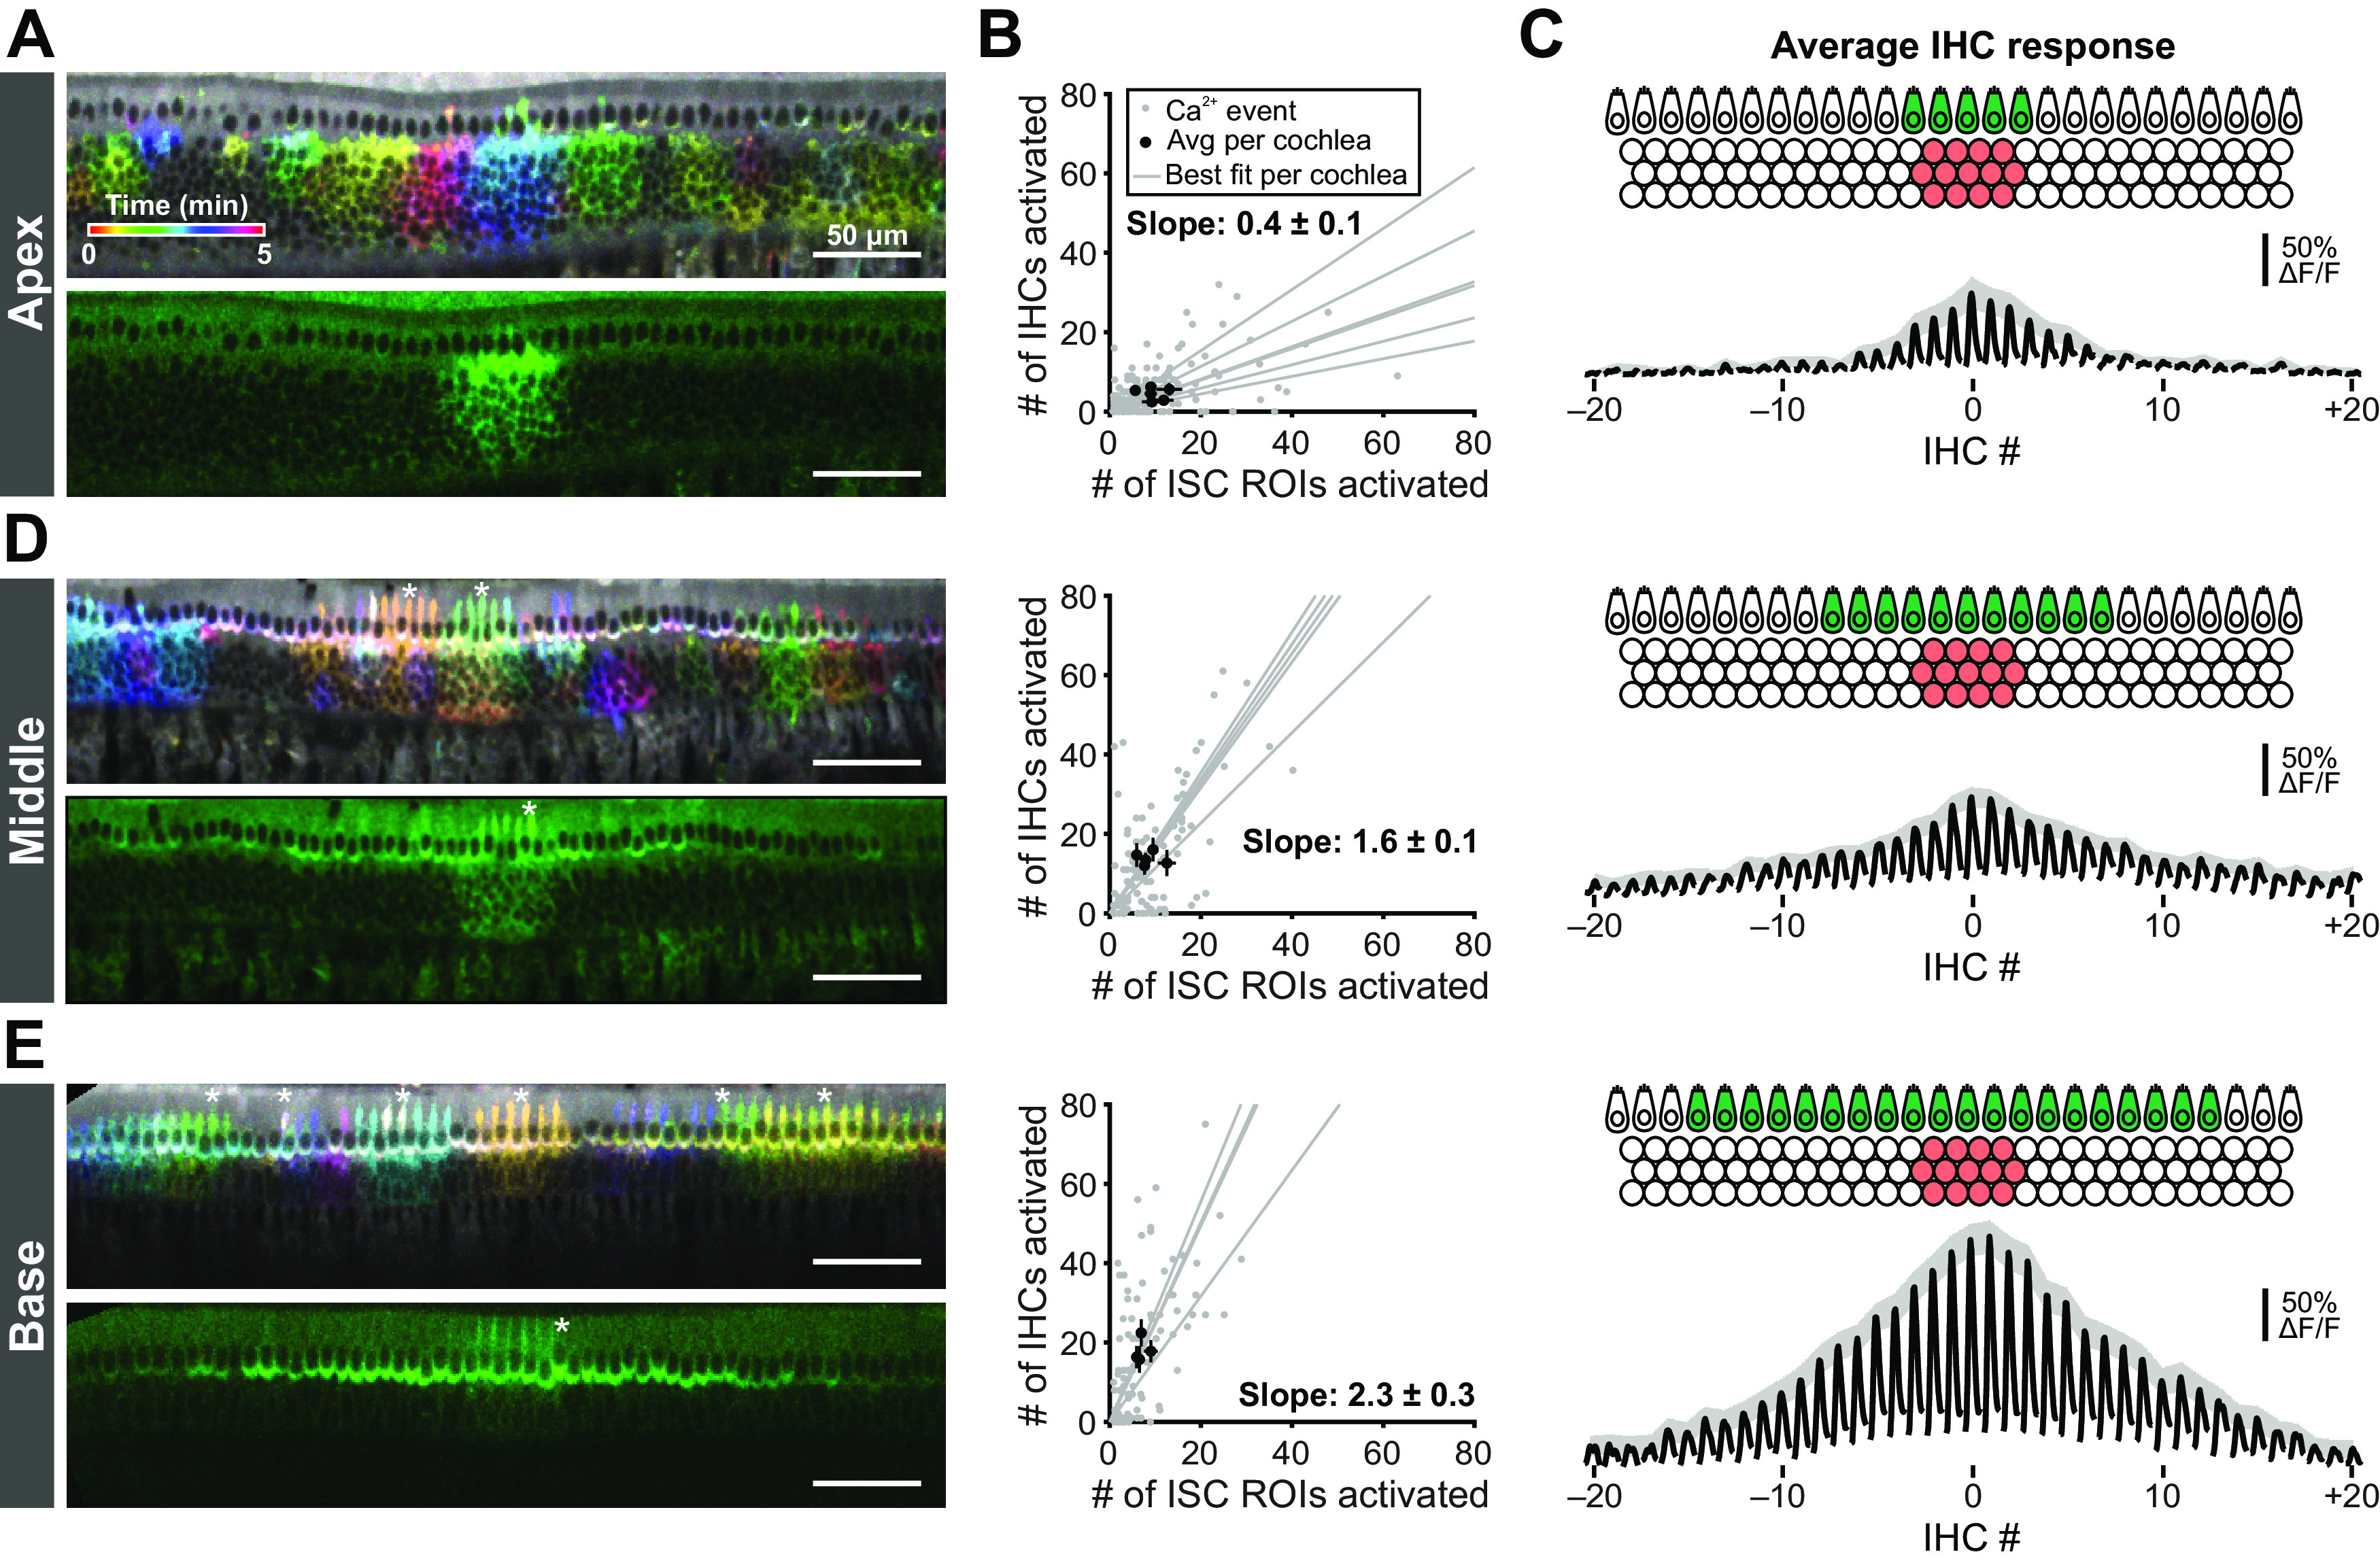
Figure 6.

Tonotopic differences in extent of IHC activation at early developmental time points. A, Images of Ca2+ transients colored based on time of occurrence (top) and exemplar Ca2+ transient (bottom) in the apical portions of cochleae isolated from P0 Pax2-Cre;R26-lsl-GCaMP3 mice. Imaging was performed at near physiological temperature (32°C-34°C). B, Plot of number of IHCs activated as a function of the number of ISC ROIs activated for apical (top, n = 6 cochleae) regions of the cochlea. Gray dots represent individual Ca2+ transients. Gray lines indicate linear best fits for each cochlea. Black dots and lines indicate the mean event size ± SEM for each cochlea. Calculated slope is the mean ± SEM of the best fit lines. C, Schematic and average IHC response for aligned ISC events in the apical (top), middle (middle), and basal (bottom) regions of the cochlea. Black traces represent the average IHC responses to an ISC event with centroid closest to center IHC (IHC at 0). Gray shaded region represents SEM for the peak of each IHC. D, E, Similar to A-C, but for middle (n = 5 cochleae) and basal (n = 4 cochleae) portions of the cochlea. Asterisks indicate activated inner phalangeal cells.
